¶ Telematics - Views
¶ 0.Tile View
|
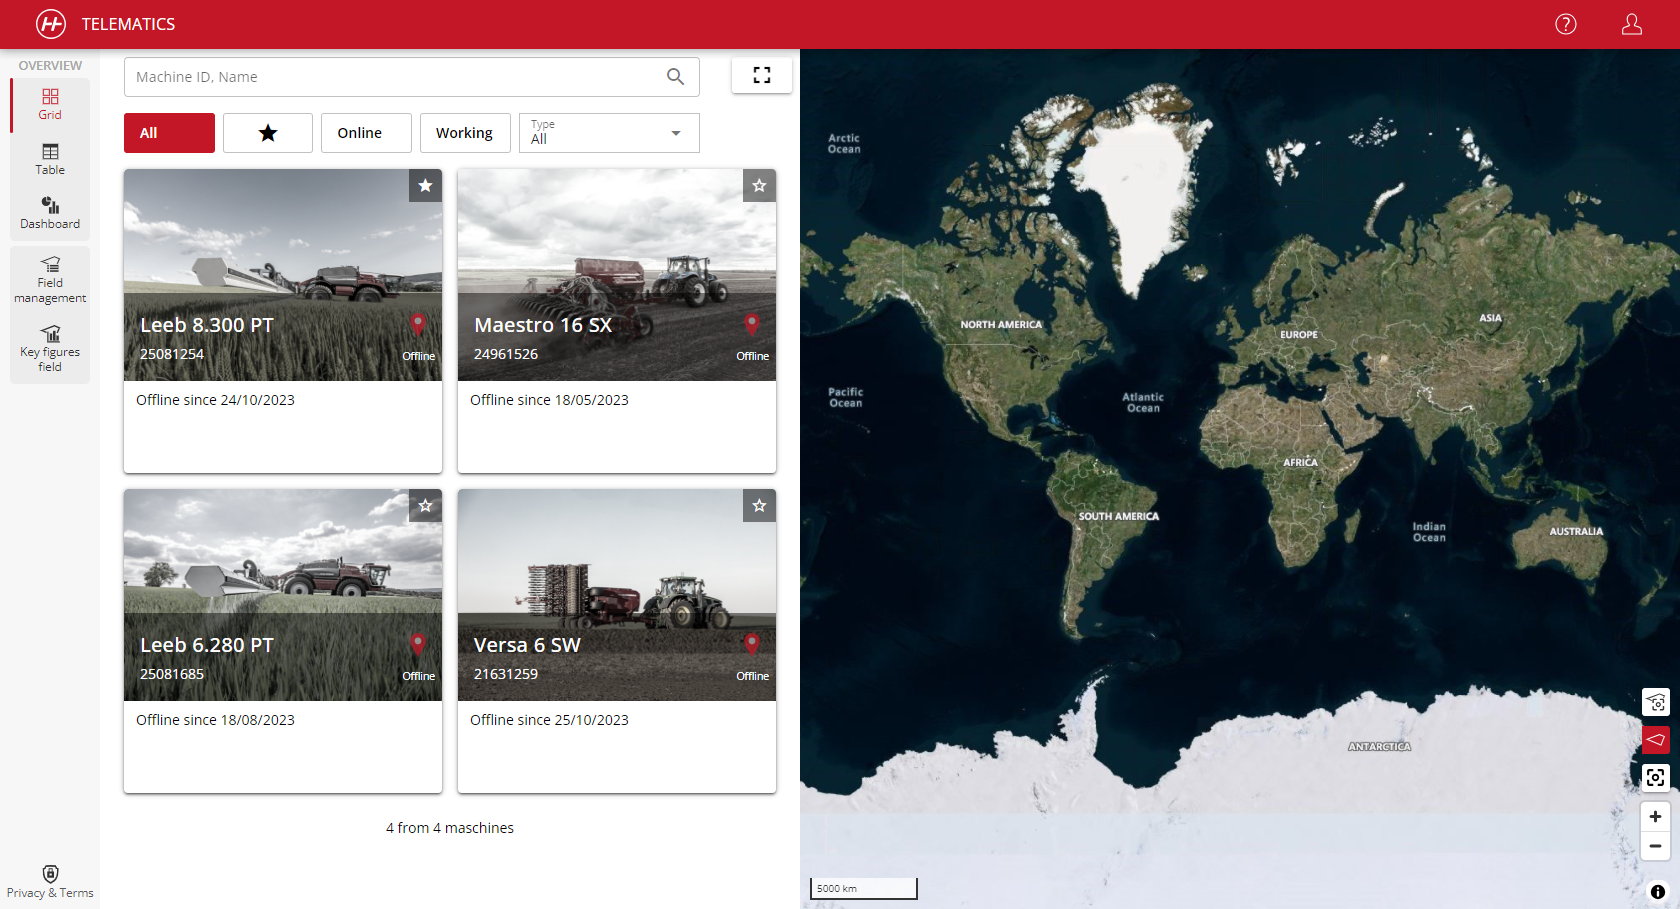
Upper section (red bar, logo & account): The top section of the page features an eye-catching red bar that houses the company logo and the account area. This area serves as a central point of contact for identification and account management.
Left-hand area (various views: Machine Tile, Table, Dashboard, Field Management): The left section presents a variety of view options, including machine tiles, table views, dashboards and field management functions. This structured arrangement enables efficient navigation between different display formats and thus provides a comprehensive overview of the telematics data.
Main area (display area of the various views; machine tiles & map view by default): The main area takes up most of the website and functions as the display area for the selected views. Machine tiles and a map view are presented here by default. This area provides the visual representation of the telematics data and enables detailed analysis and monitoring. |
|
¶ 1. Table View
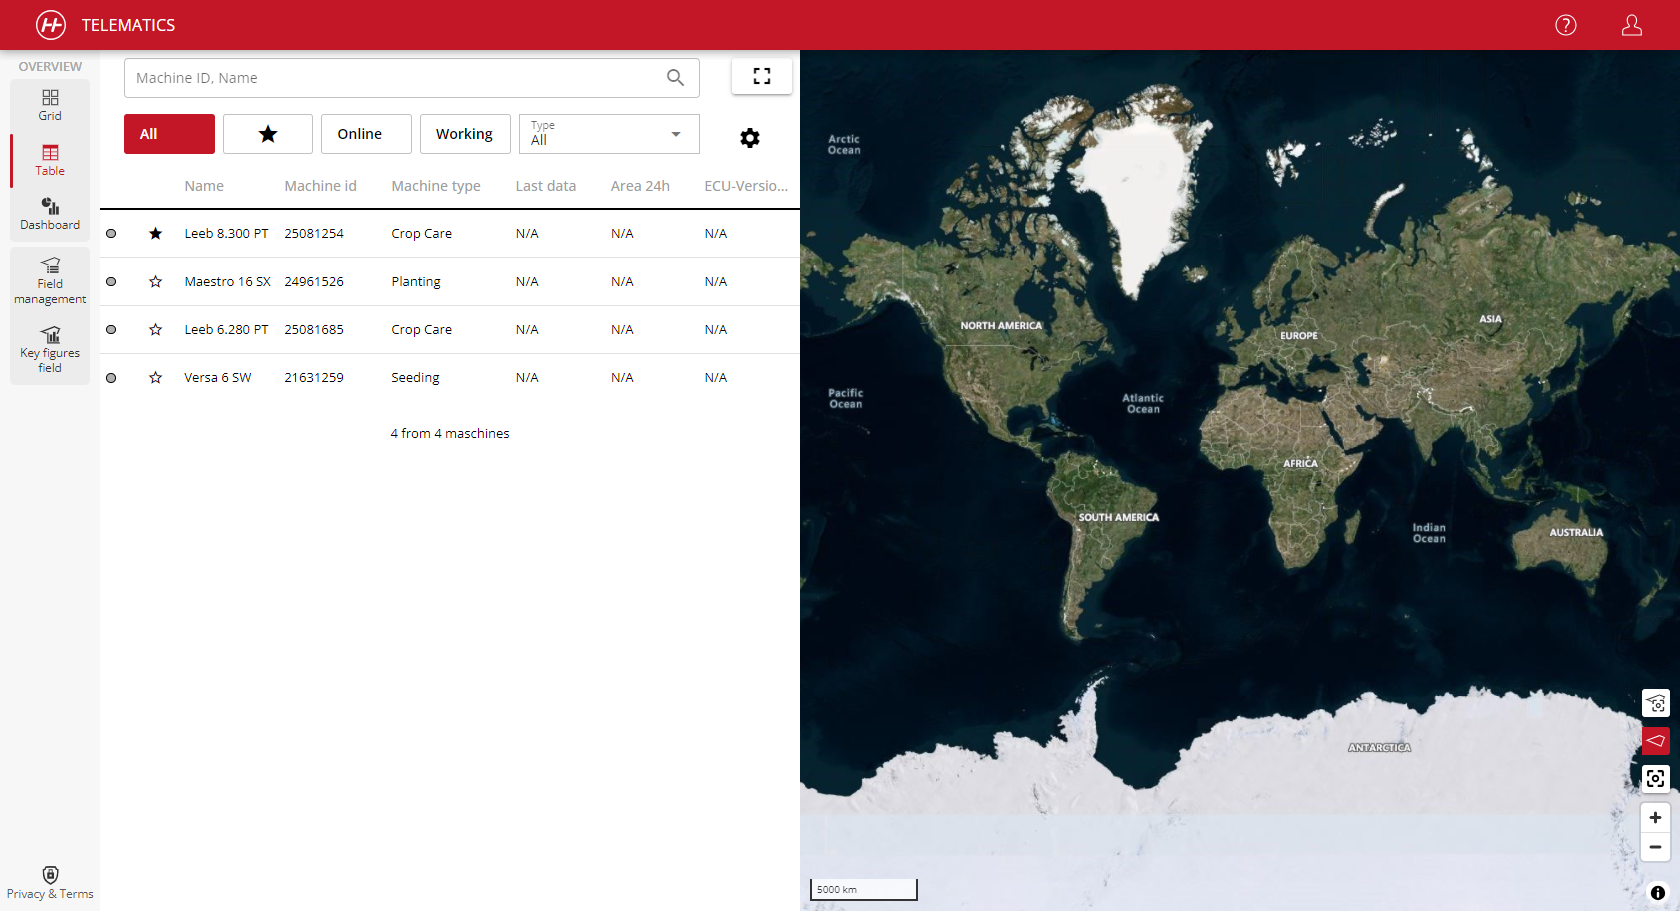
| By default, the machine tile, table and dashboard views are displayed in the left-hand area (view picker). In the tile and table view, you can filter by chassis number, name and SmartCan number. |
|
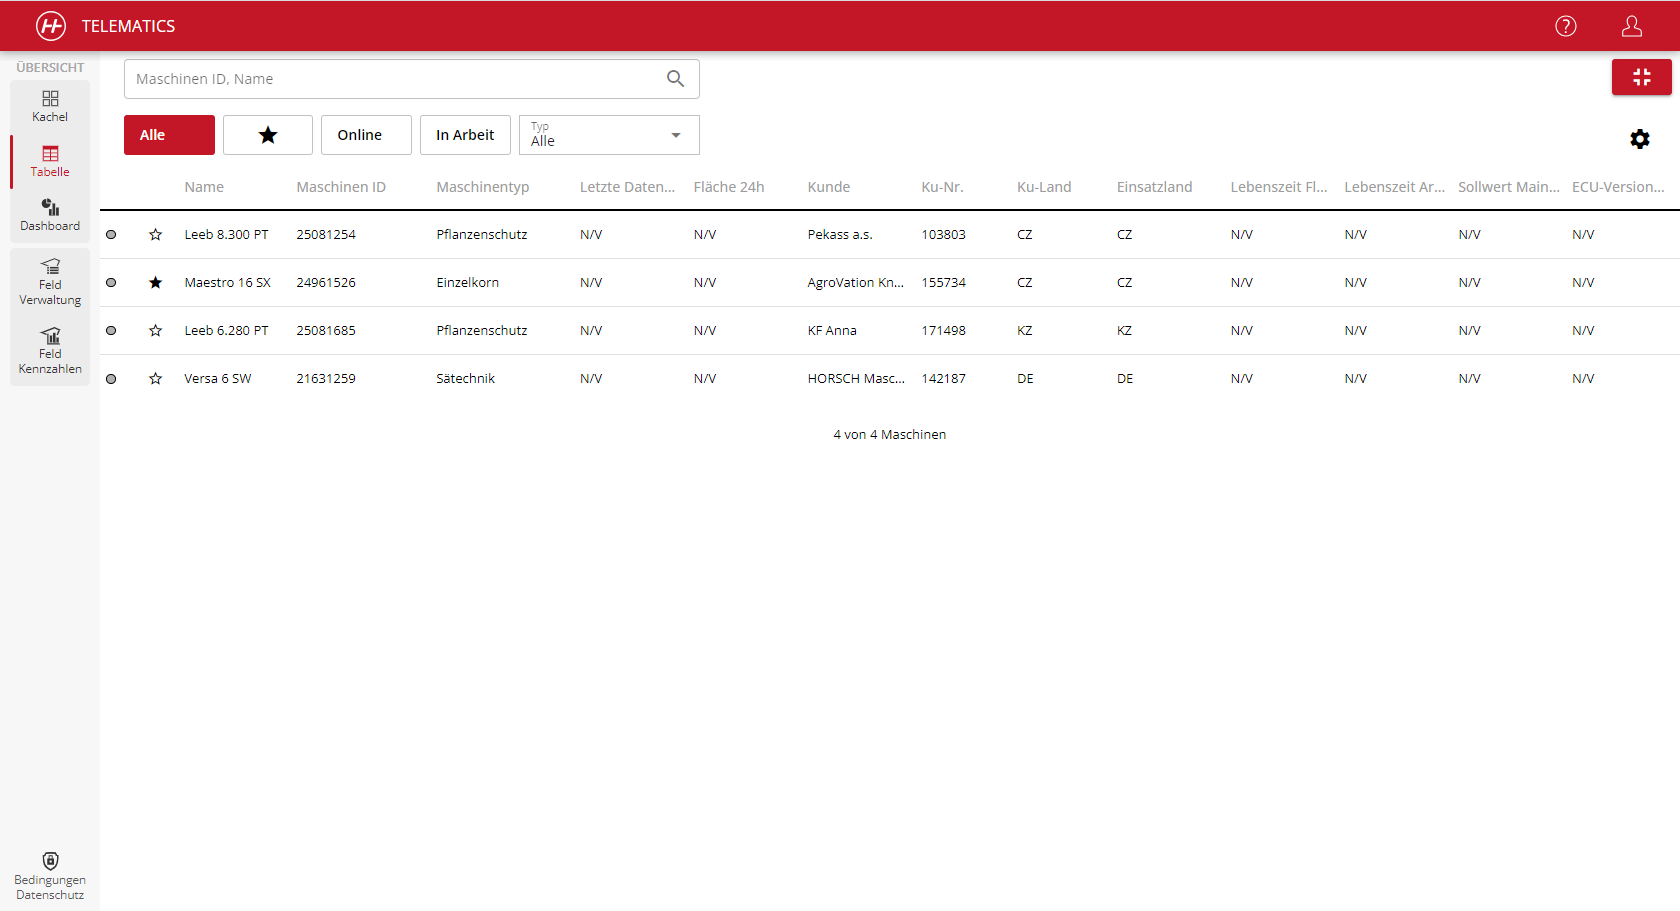
| In addition, the machine selection can also be limited by predefined filters for machines that have the status Online or In progress. Furthermore, you can filter by machine type (all, single grain, sowing technology, crop protection, hybrid, tillage). |
|
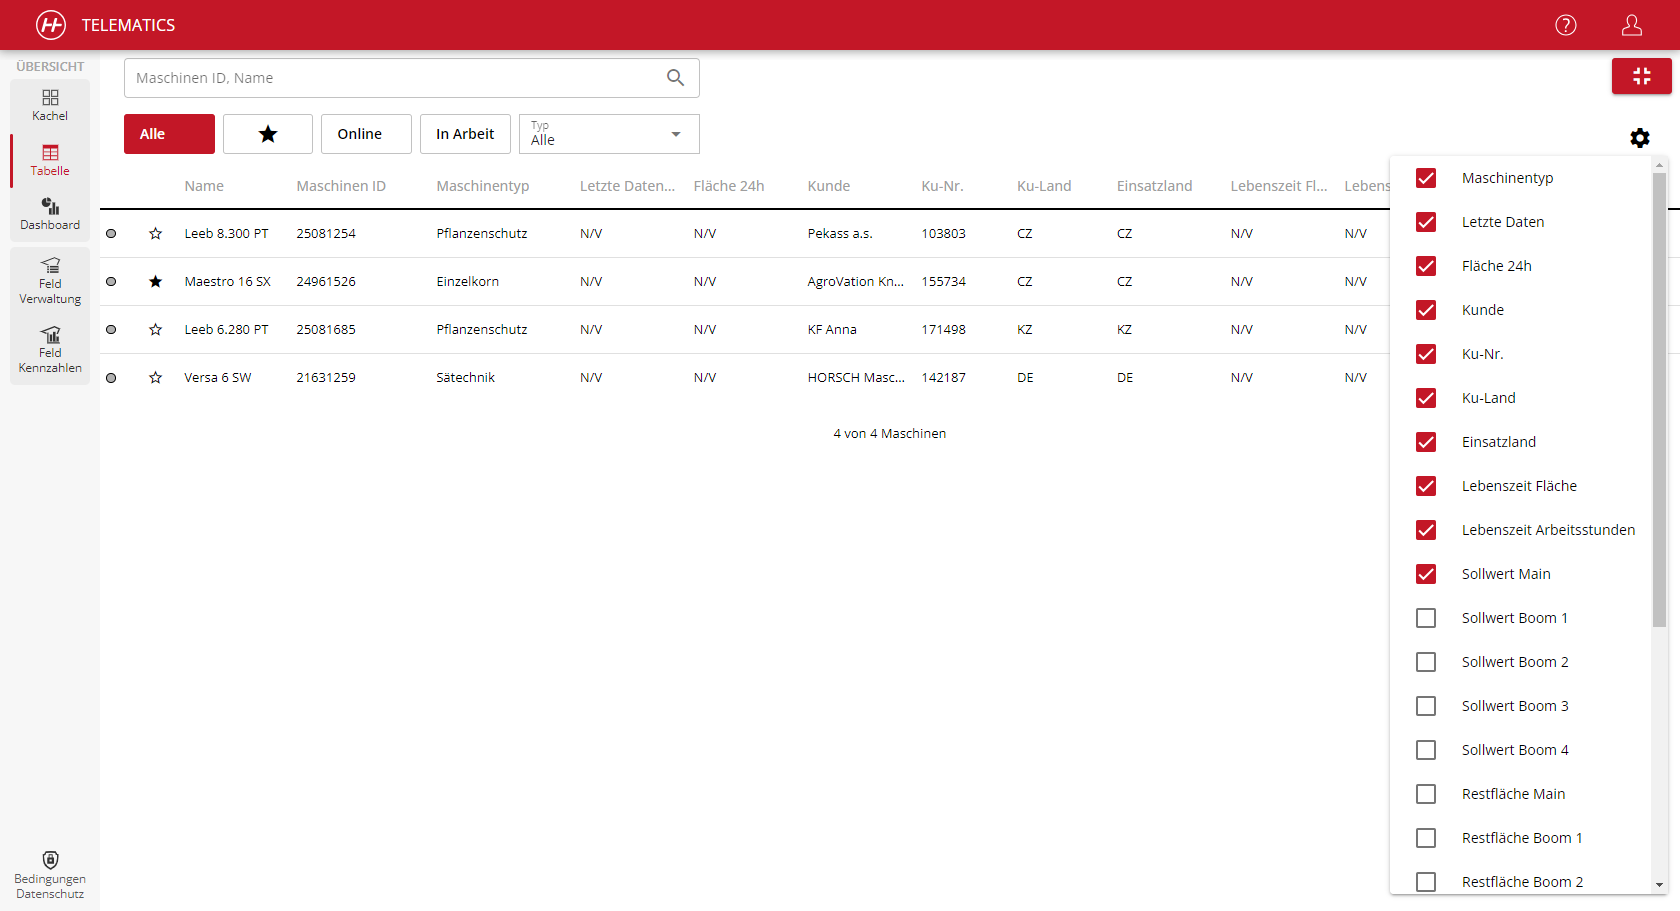
| The columns displayed can be customized using the gear wheel (right-hand side of the view). Various values such as machine type, service life area, country of use etc. can be selected here. These are then displayed as standard in the table view (Fig. 4). |
|
¶ 2. Dashboard
|
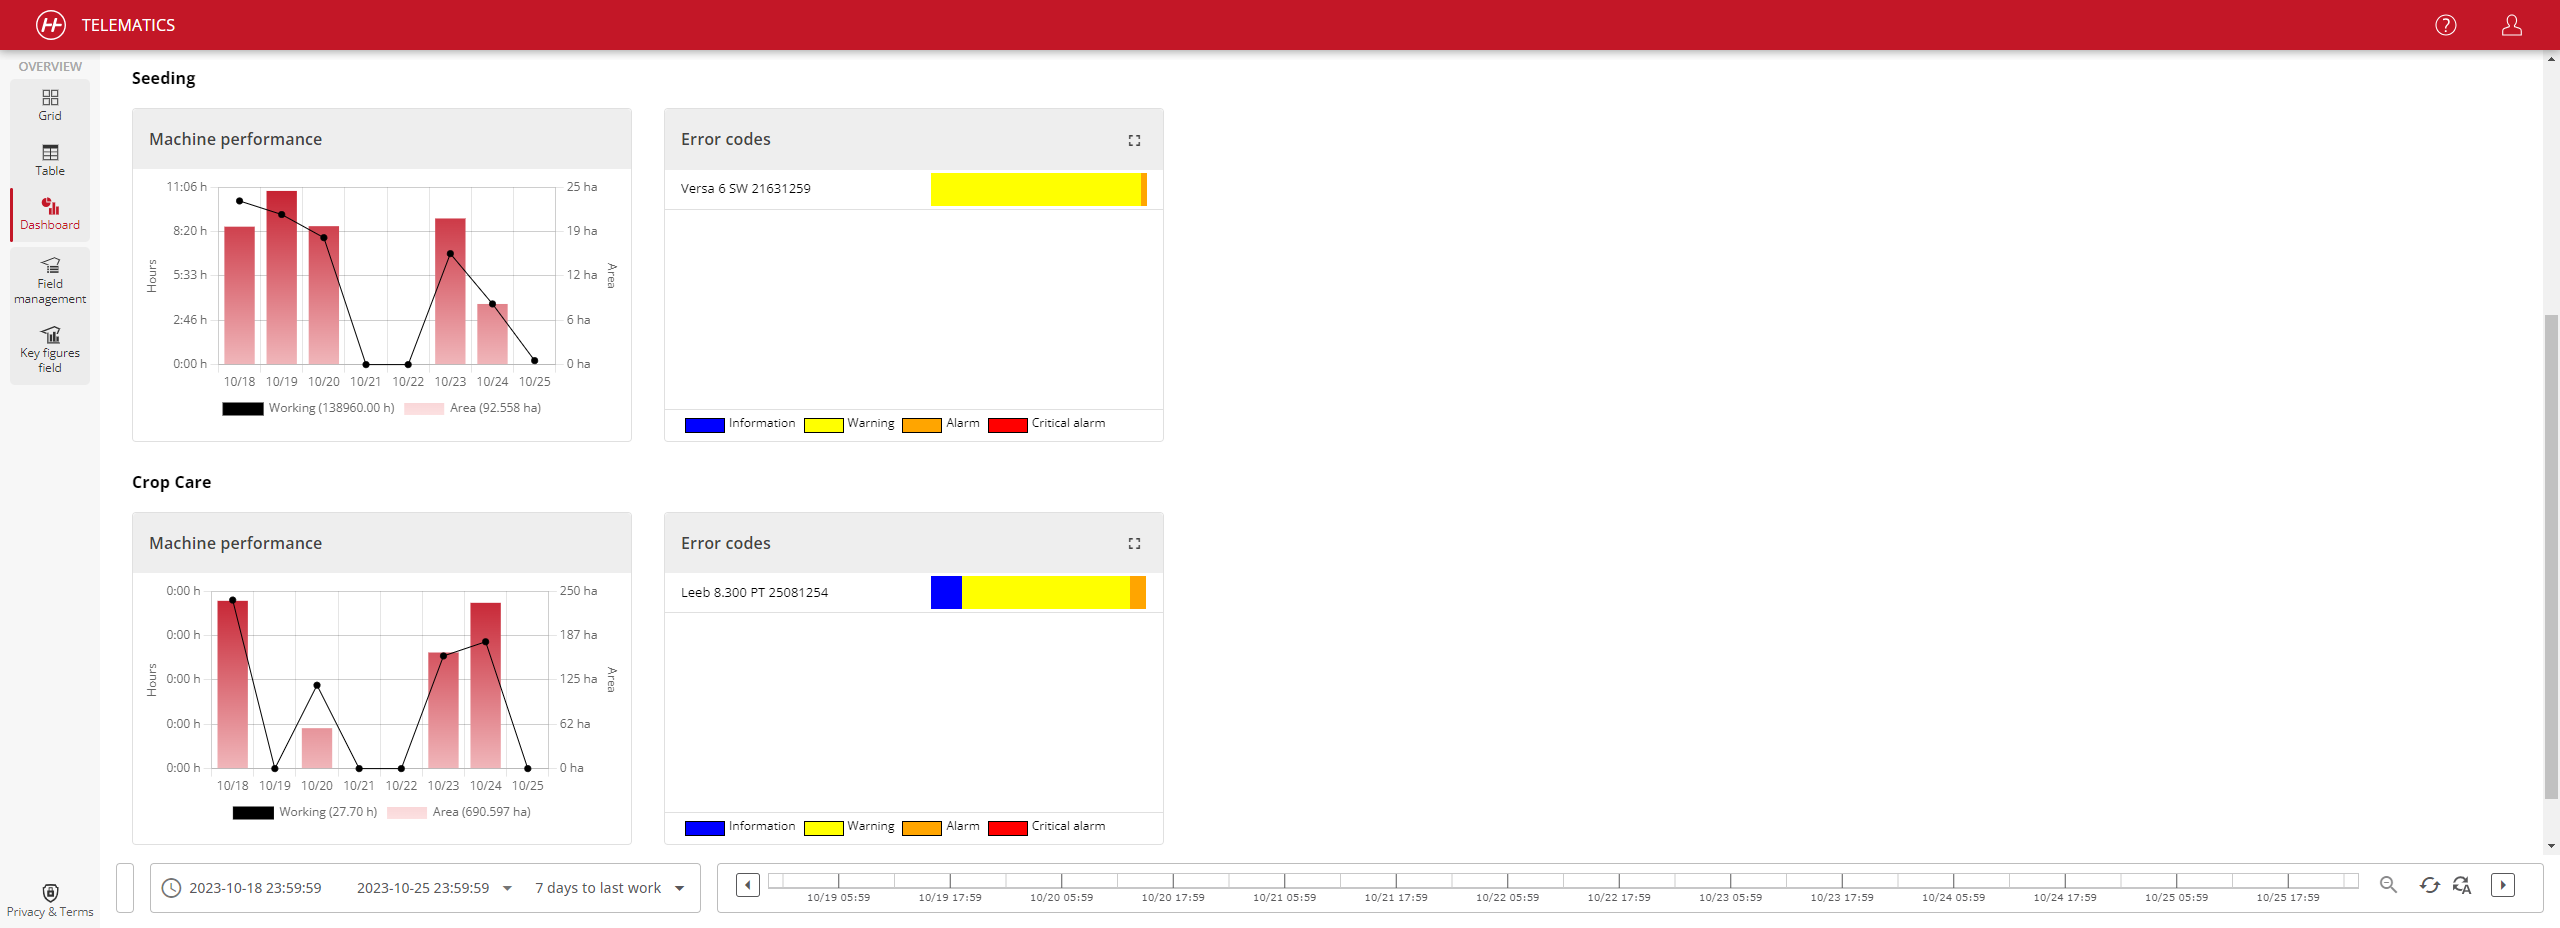
For clarity, certain statistics can also be viewed under the Dashboard tab, depending on the machine type. All machines stored in the user account are selected by default, but can be deactivated individually via machine selection. Different statistics are displayed depending on the machine category (single grain, sowing technology, crop protection):
This data can be used to display fleet evaluations of performance and any maintenance that may be required. |
|
¶ 3. Field View & Field Key Figures
|
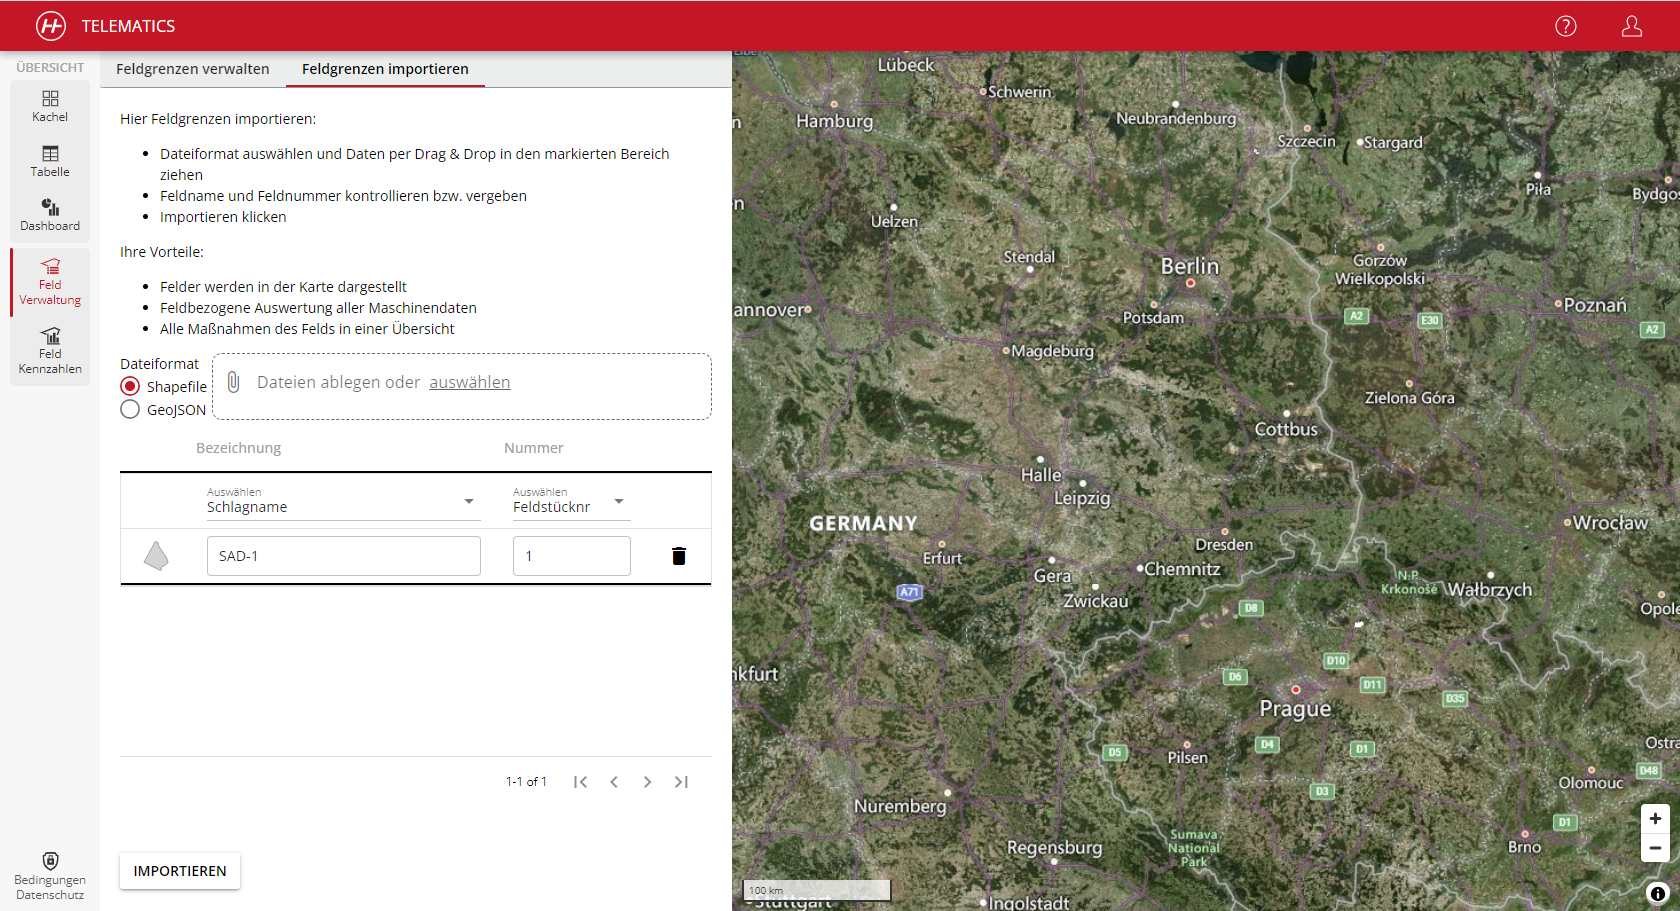
One of the core features of Horsch Telematics is working with field boundaries and key figures. To be able to work with this, the field boundary data must be uploaded as a GeoJSON or shape file under the Field management → Import field boundaries tab.
Note: When uploading shape files, the individual values from the shape file can be selected in the drop-down menu (see Figure 3.1). |
|
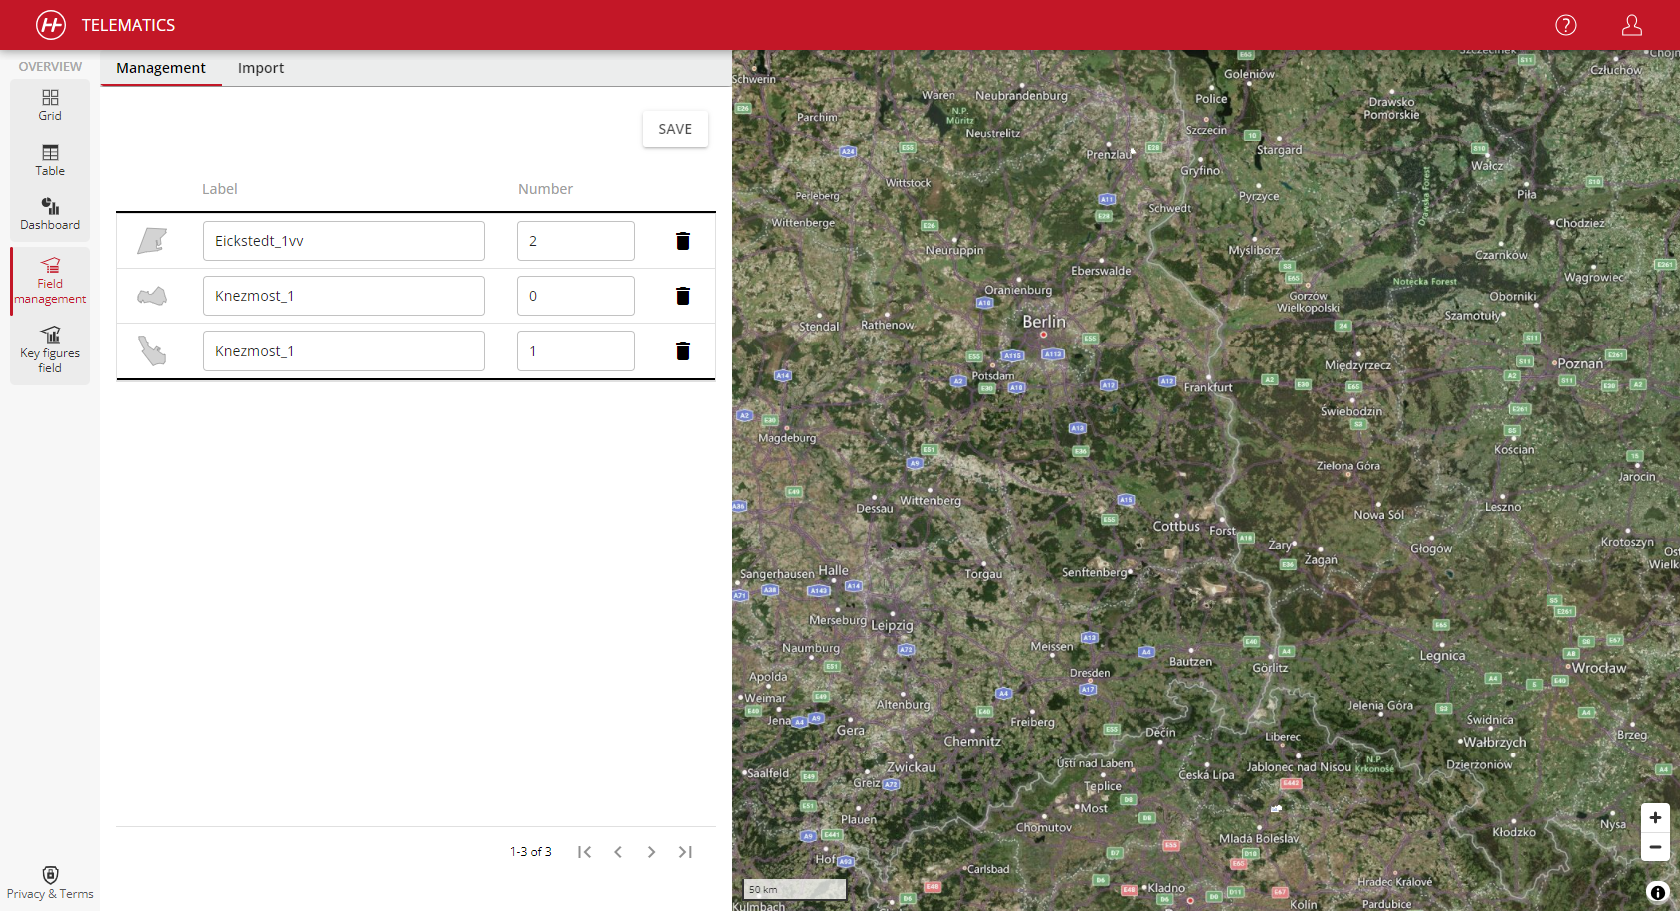
The field boundaries are stored in the system via the Import button and the name/field number can be edited under Manage field boundaries (see Figure 3.2).
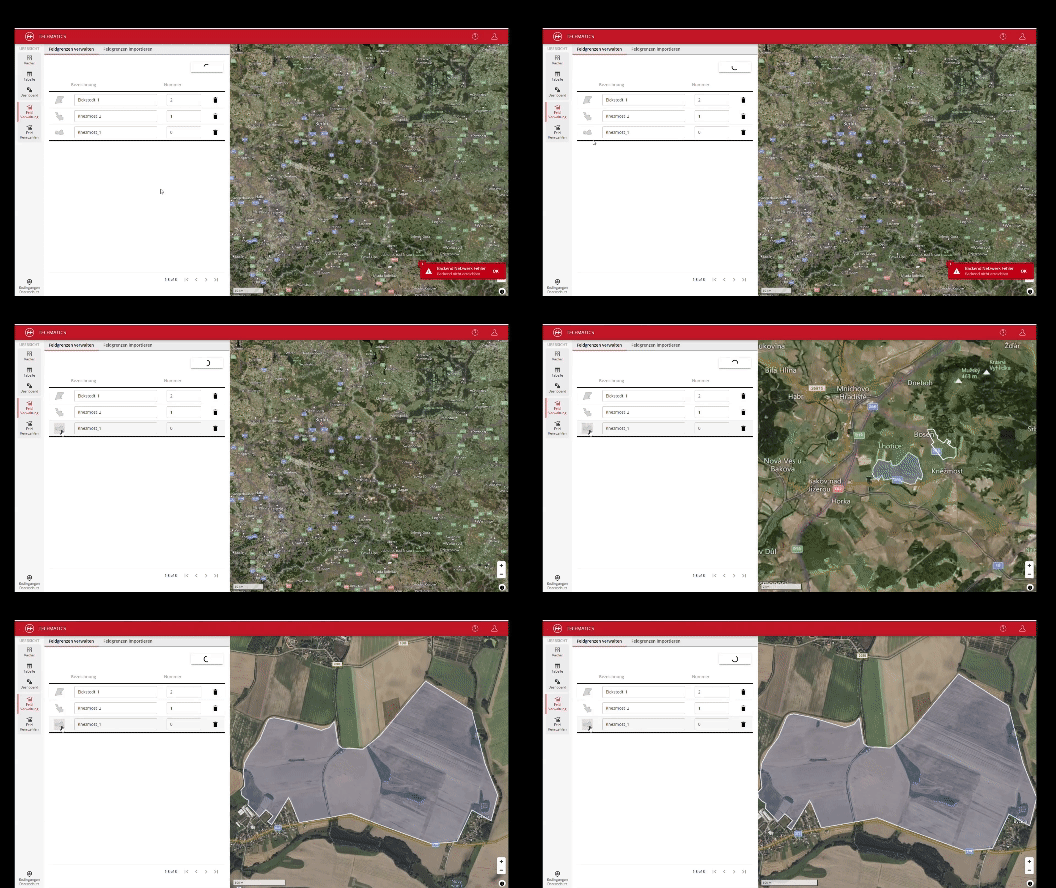
Note: Clicking on the field symbol automatically displays the field in the map view (Figure 3.3). |
|
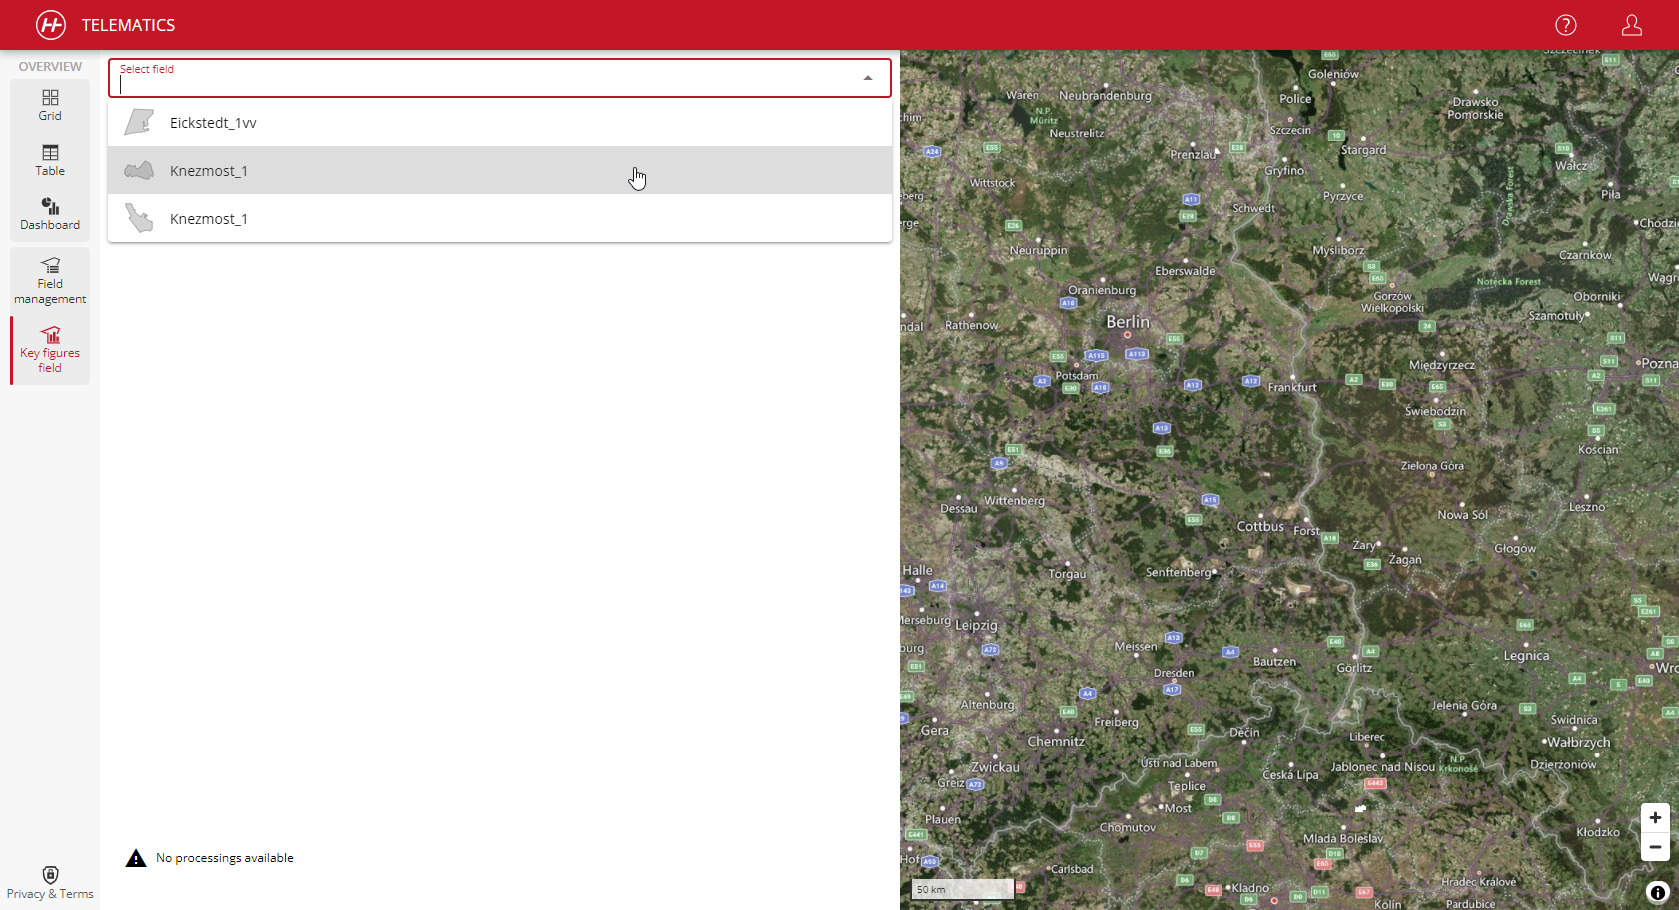
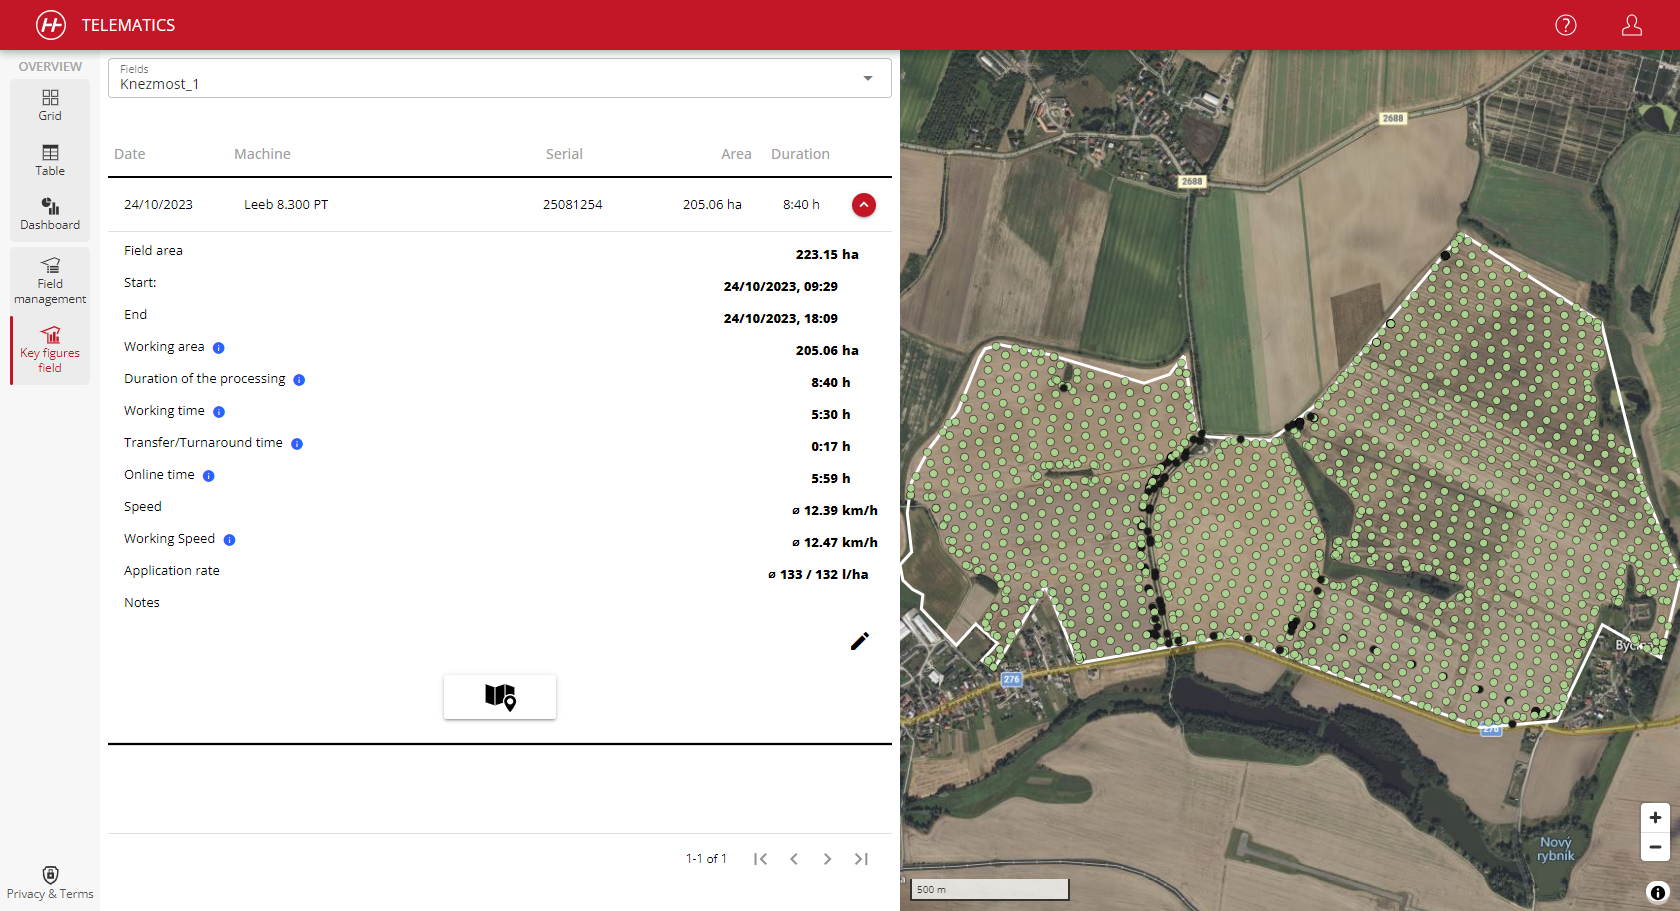
All fields stored in Telematics can be individually selected and evaluated under the Field key figures tab (Figure 3.4). After selecting a field, machine-specific evaluations of the work processes can be displayed (Figure 3.5). |
|
Note: You can use the map button below the operation to jump directly to the relevant period in the map view. In addition, notes/comments can be added to the respective work process via the pencil button, for example on the use of varieties or spraying agents. It is possible to record important details and observations to ensure precise documentation of the work steps. This not only makes it easier to trace activities, but also enables improved planning of future work processes. |
¶ 4. Map View - Machine-specific Display
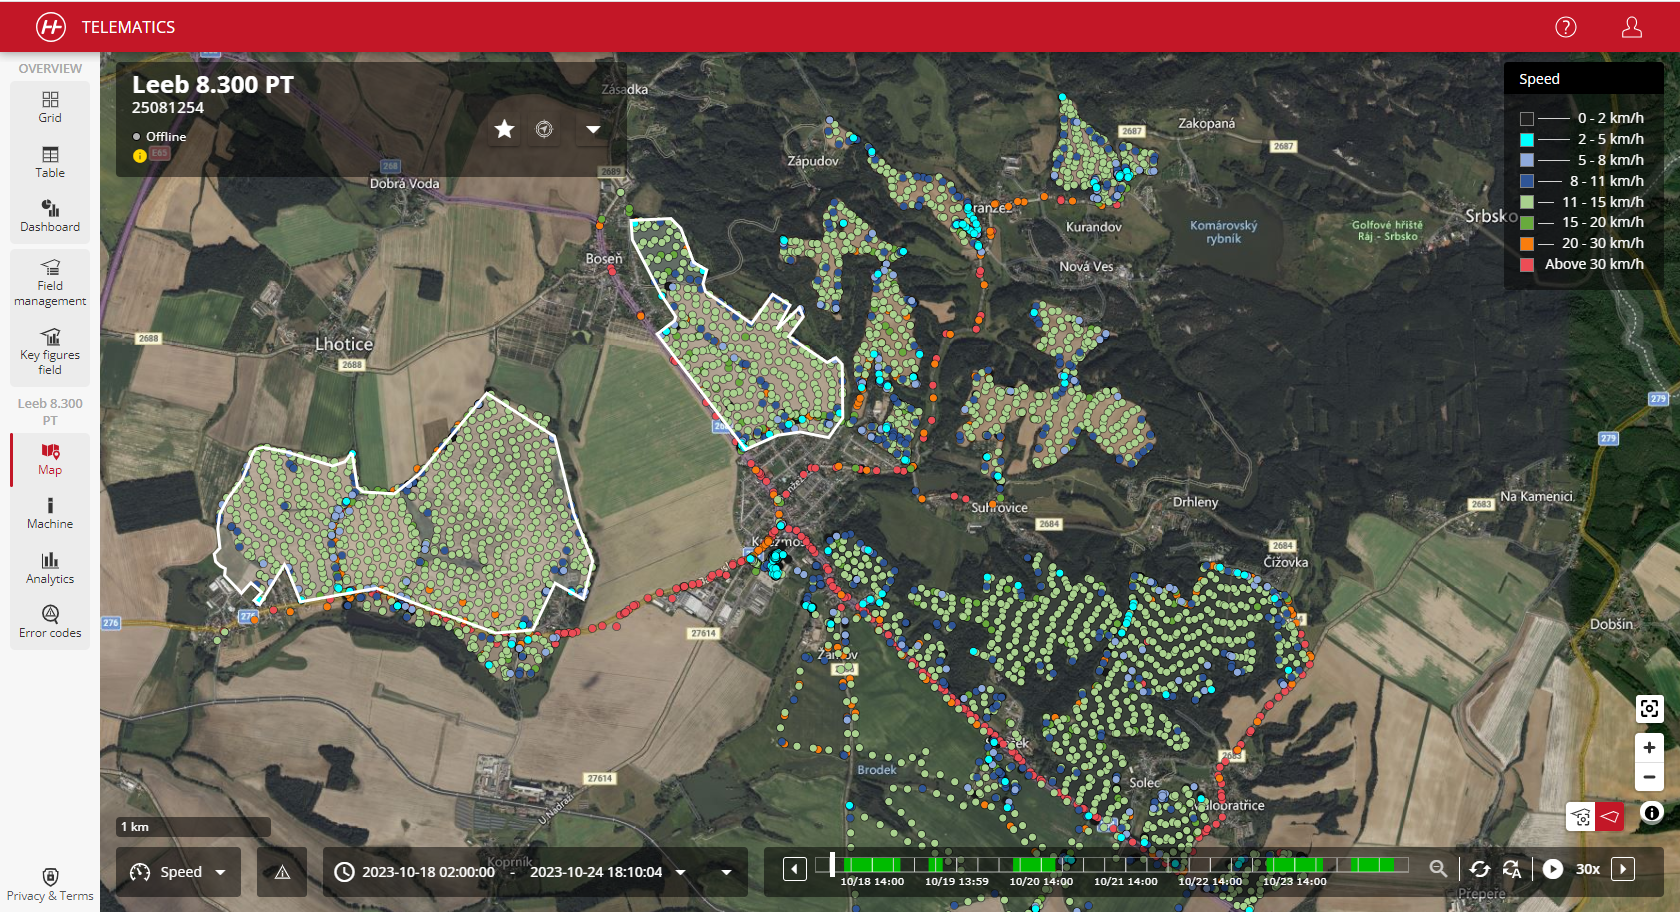
| After selecting a work process or machine, the display switches to the map view. All relevant machine data (name, chassis number, status, etc.) can be entered here at a glance (Figure 4.1). |
|
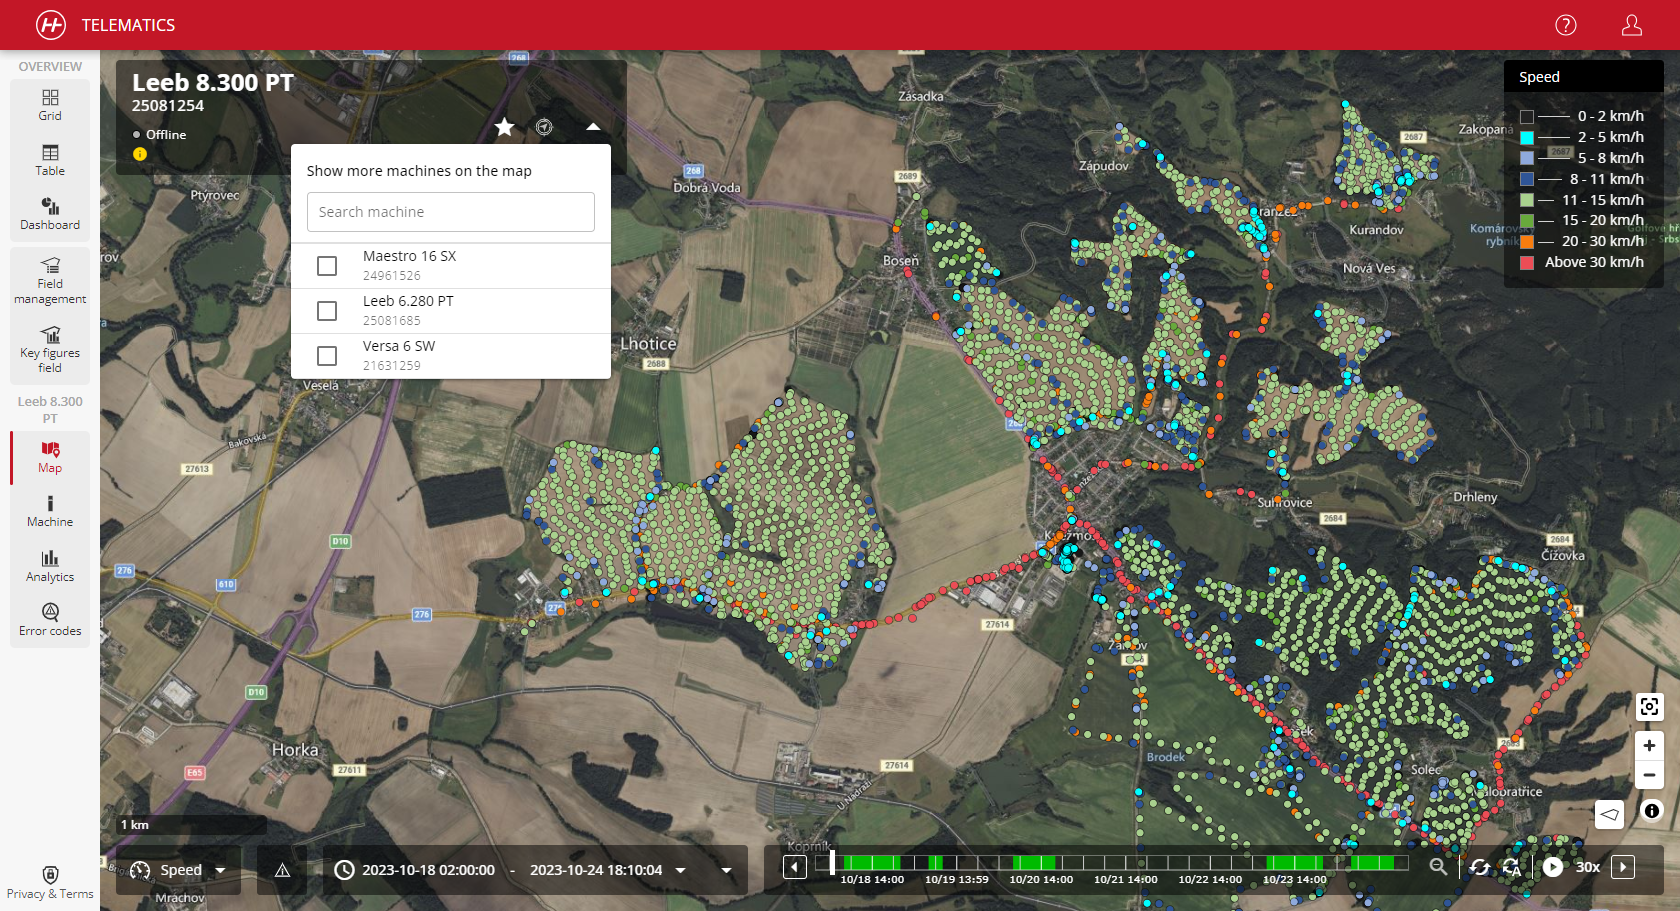
| As usual, the zoom level can be adjusted to display a detailed view of the work process. This function makes it possible to focus on specific details and maintain an overview of the entire process. Several machines can also be selected at the same time (see Figure 4.2). |
|
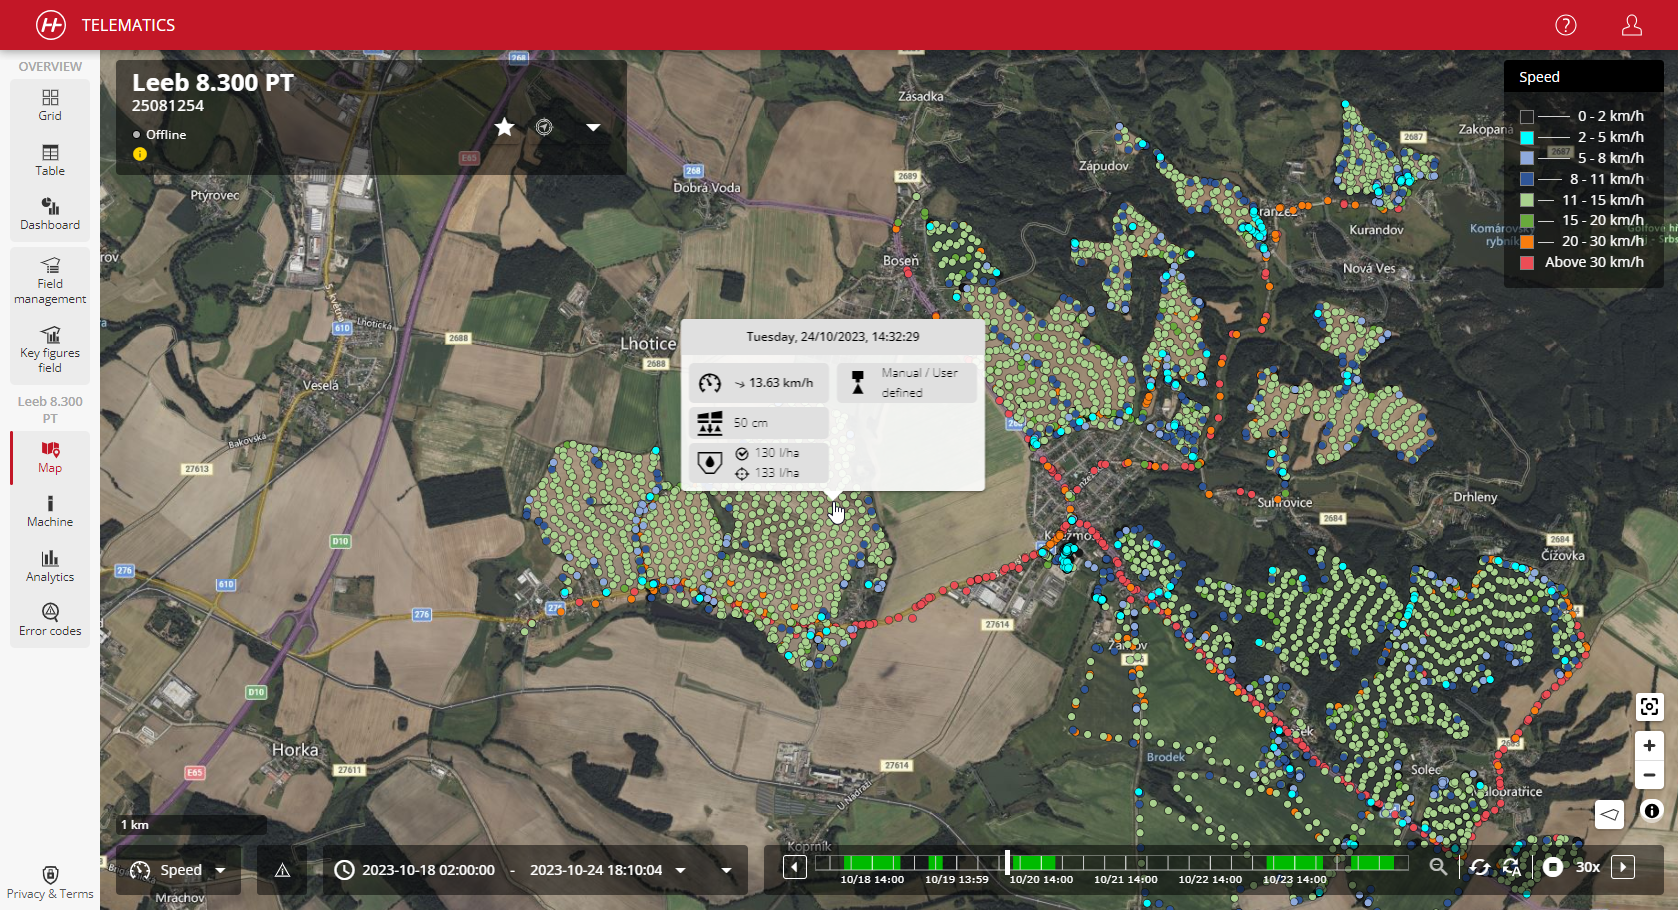
| As soon as a data point is selected with the mouse pointer, precise information on the respective data point is displayed (see Figure 4.3). This precise information can provide important insights into the progress of the work process and help to make more targeted decisions. |
|
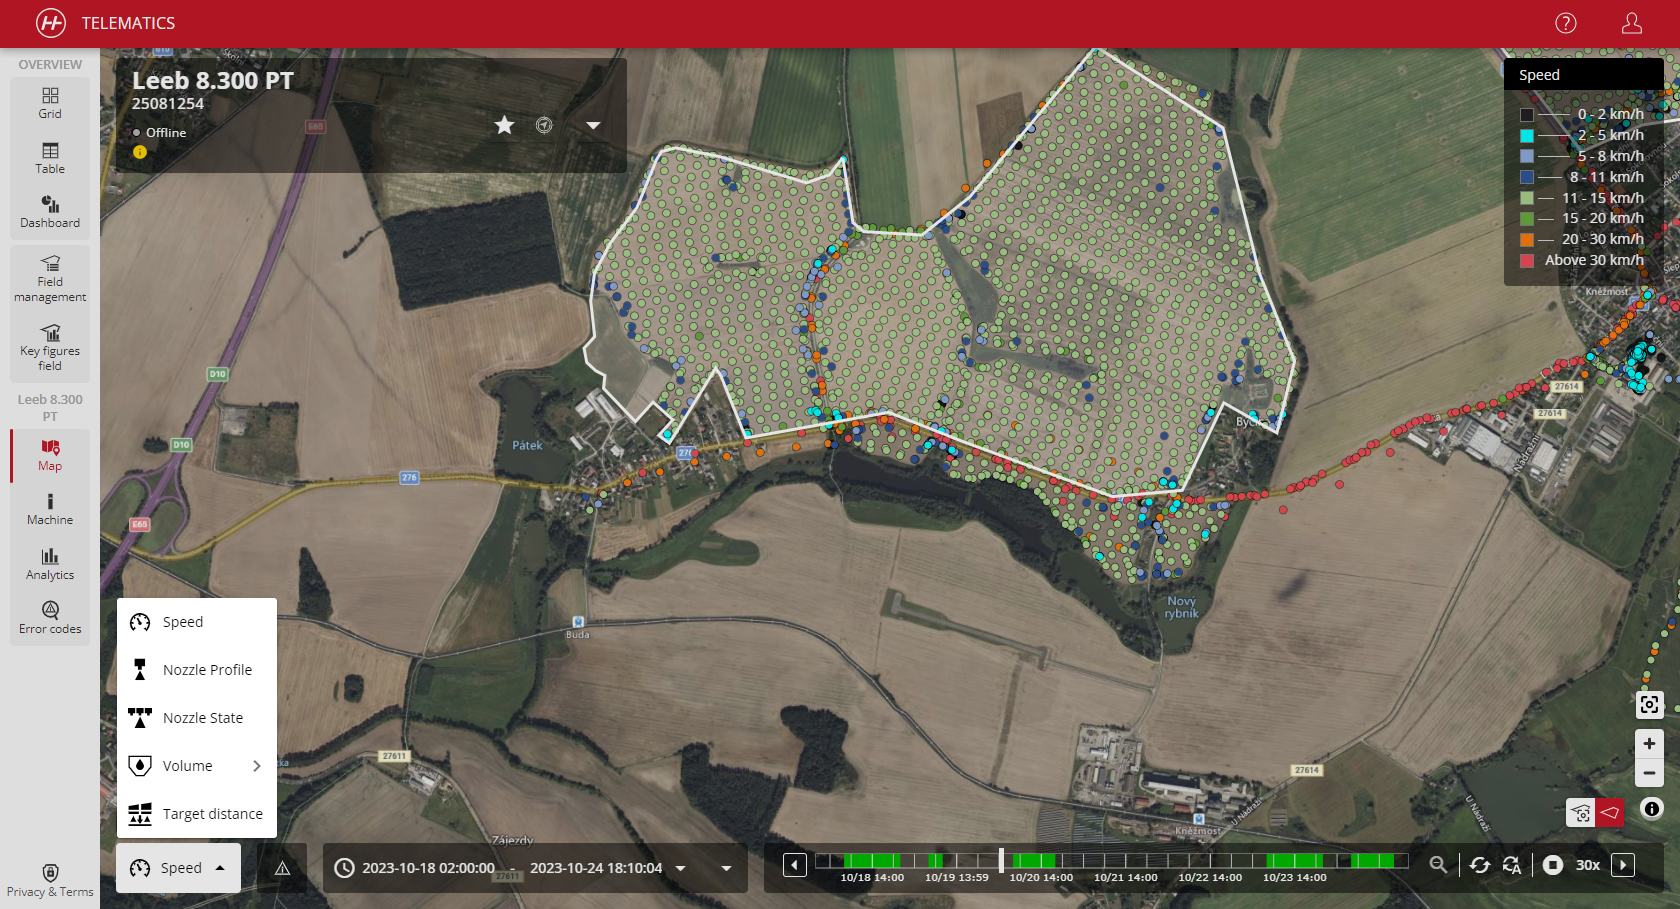
| The display of the specific data points can be adjusted at the bottom left-hand edge; by default, the speed is displayed for each machine. Different data (e.g. nozzle profile, nozzle status, target area distance, etc.) can be selected here depending on the machine type (sowing technology, single grain, crop protection) in order to be able to recognize deviations during the work process at a glance (Figure 4.4). Note: Nozzle status is only shown on machines with RAVEN PWM nozzles. Otherwise, nothing is shown. |
|
|
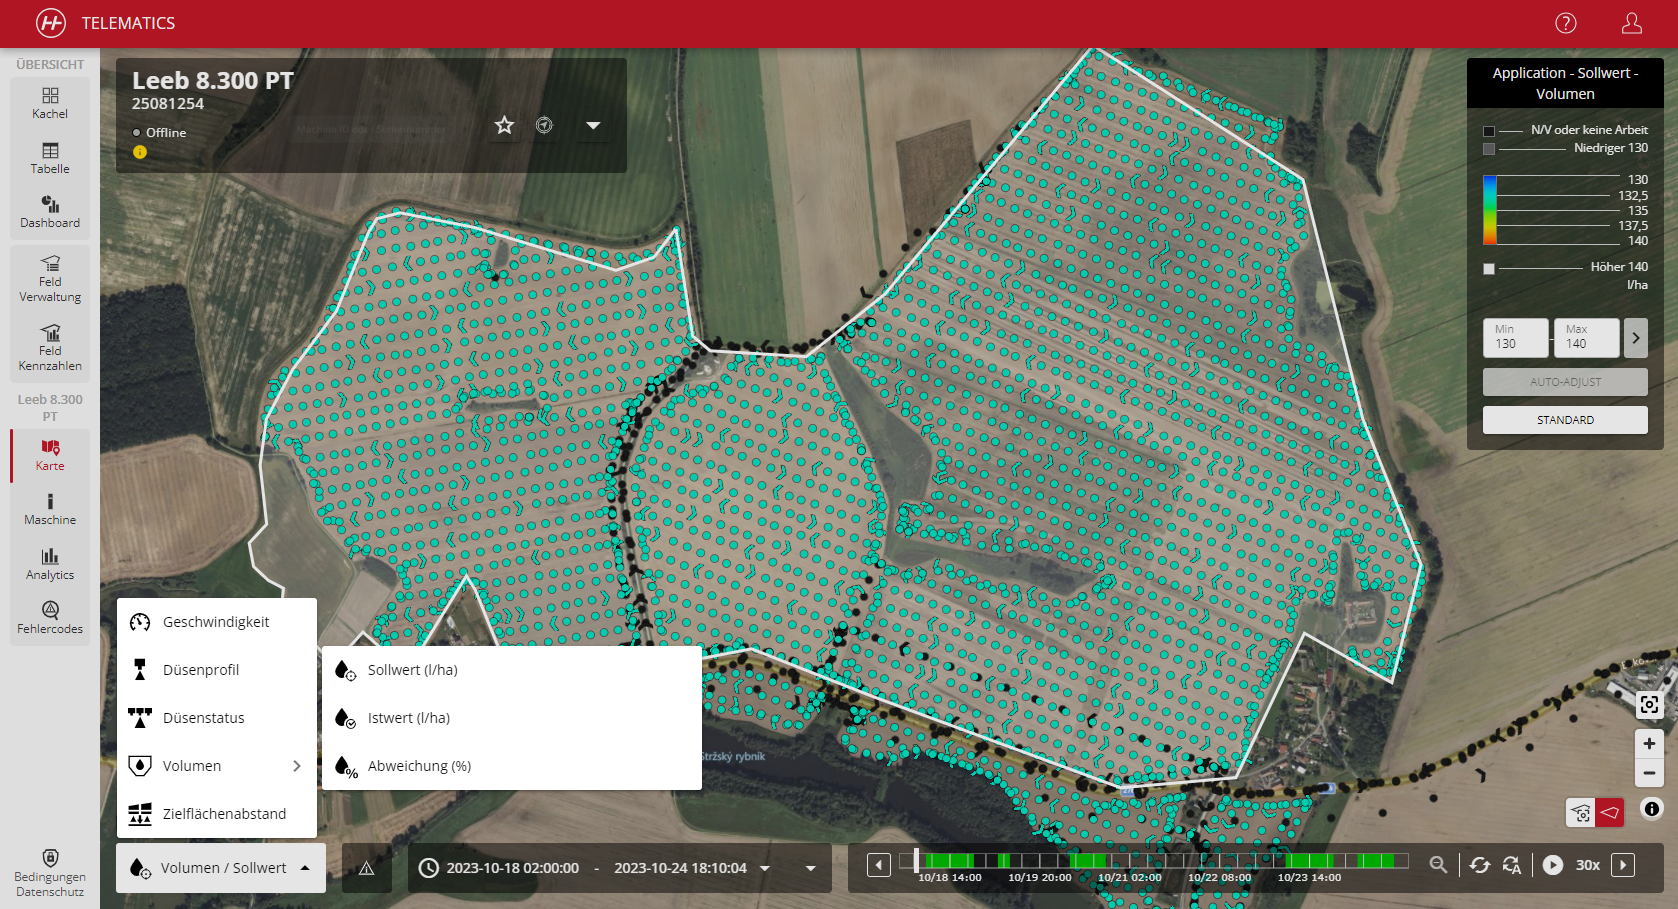
Note: The actual work processes of the machine can also be analyzed by selecting the target output quantity. All points marked in black represent states where no work signal was present. For crop protection, this is shown via the volume (Figure 4.5), for sowing technology via the weight/boom 1.
Note: The target value is the value stored in the TaskController, whereas the actual value is the value recorded by the job computer in the field. |
|
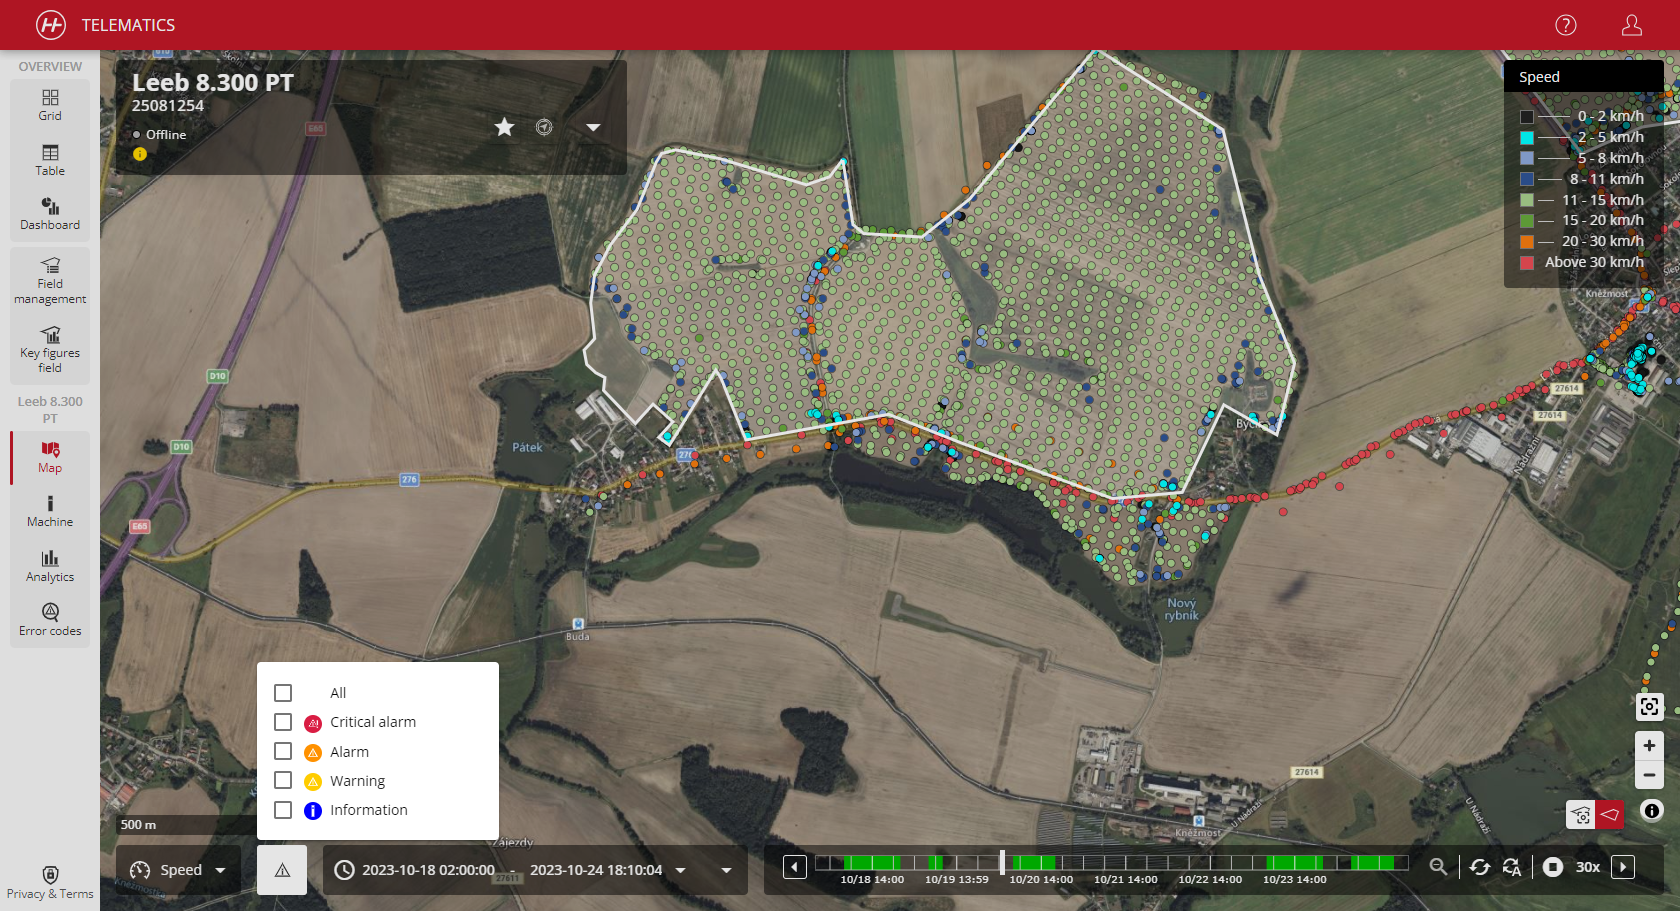
| Another important function is that warning and error messages can also be displayed in the map view. Here you can select which messages are to be displayed on the map (Figure 4.6). These are then displayed on the map exactly where the message originated. |
|
|
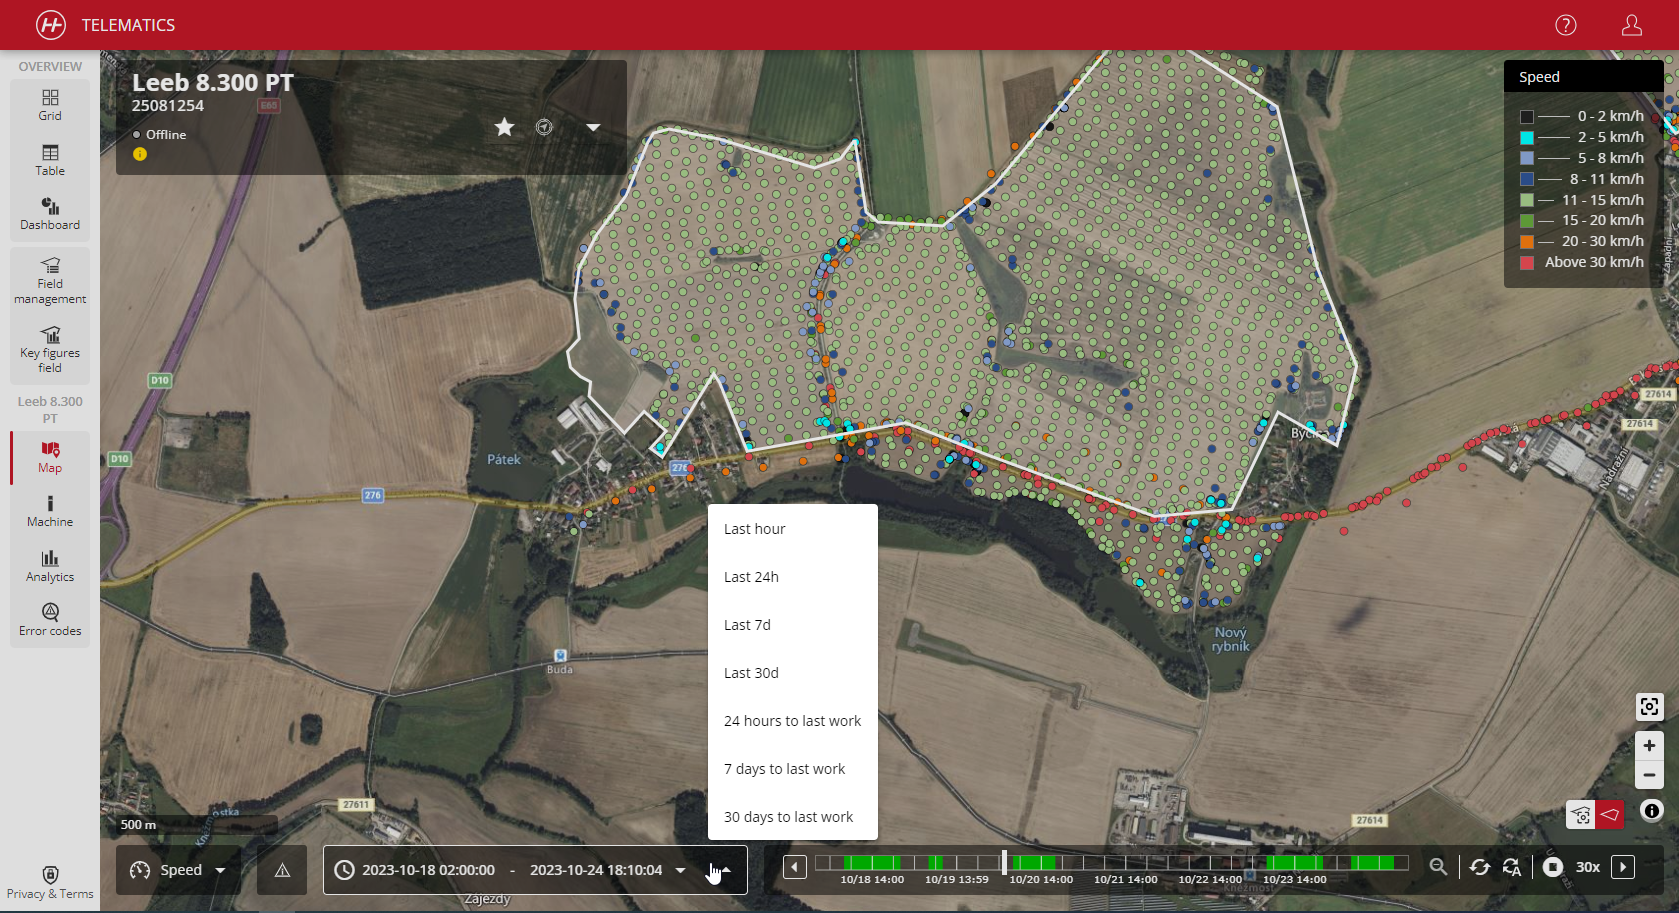
To the right, a precise display time can be selected via the period selection. Here you can either select specific days via the date selection (days with work processes are highlighted in green) or predefined filters (last hour, last 24 hours, etc.). The work process can then be illuminated to the minute using the timeline on the right. (Figure 4.7)
Note: Updating the map during an active work process can be activated via the "Update automatically" button. To do this, "Approach tracks virtually" must be activated! |
|
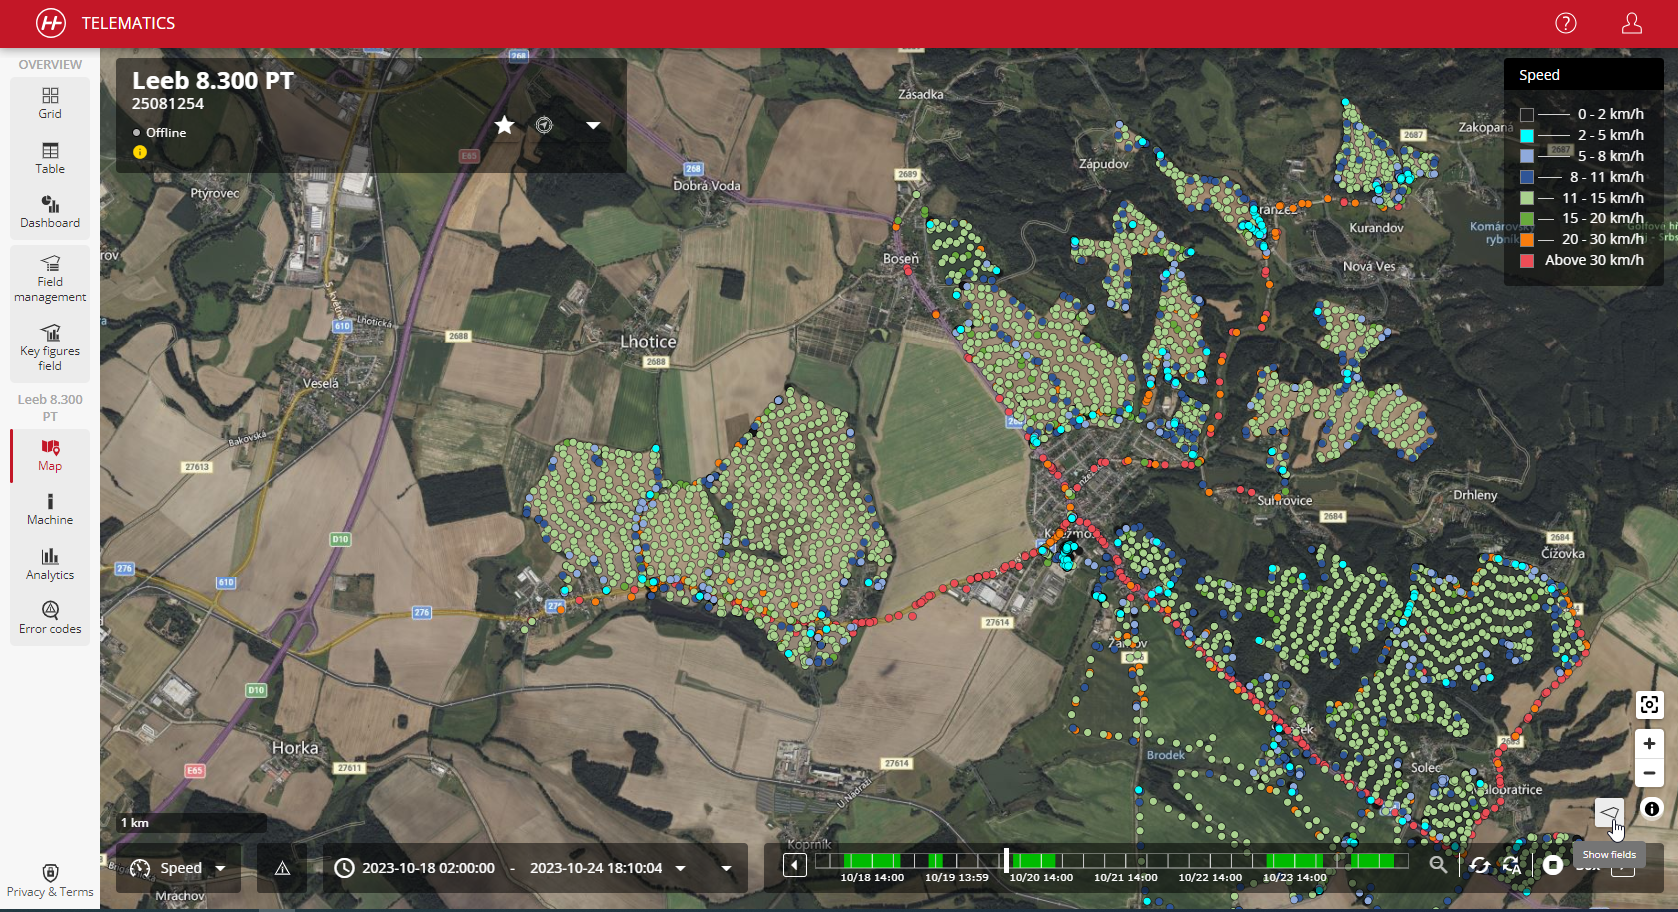
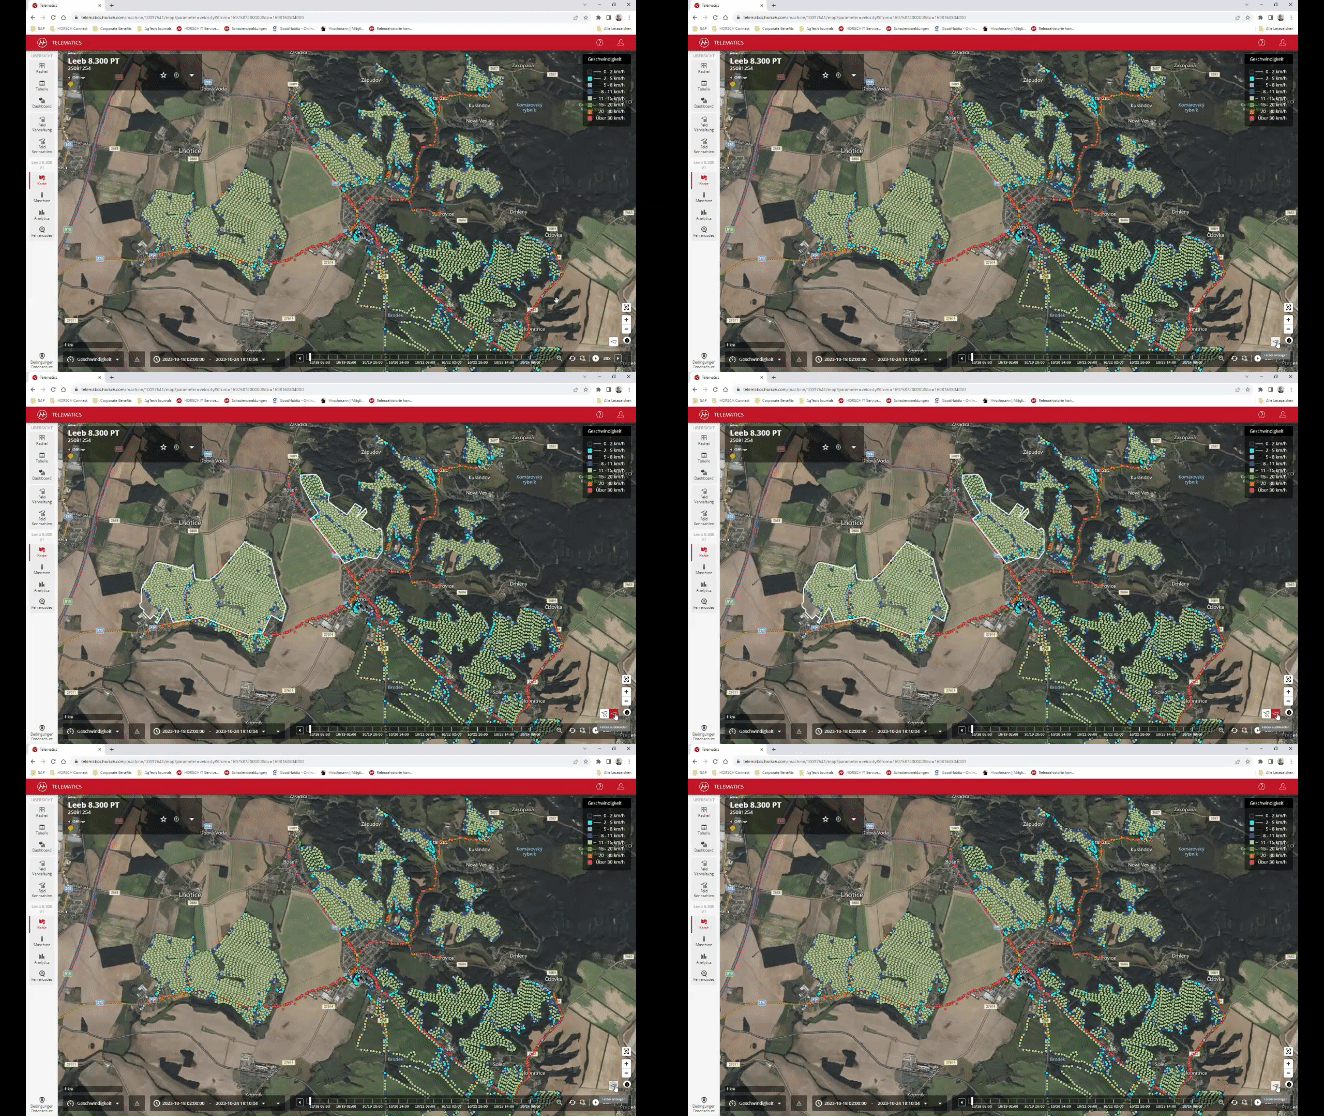
| To activate or deactivate the display of the field boundaries, you can select the Show fields button (Figures 4.8 & 4.9). This button allows you to control the display of the field boundaries as required. |
|
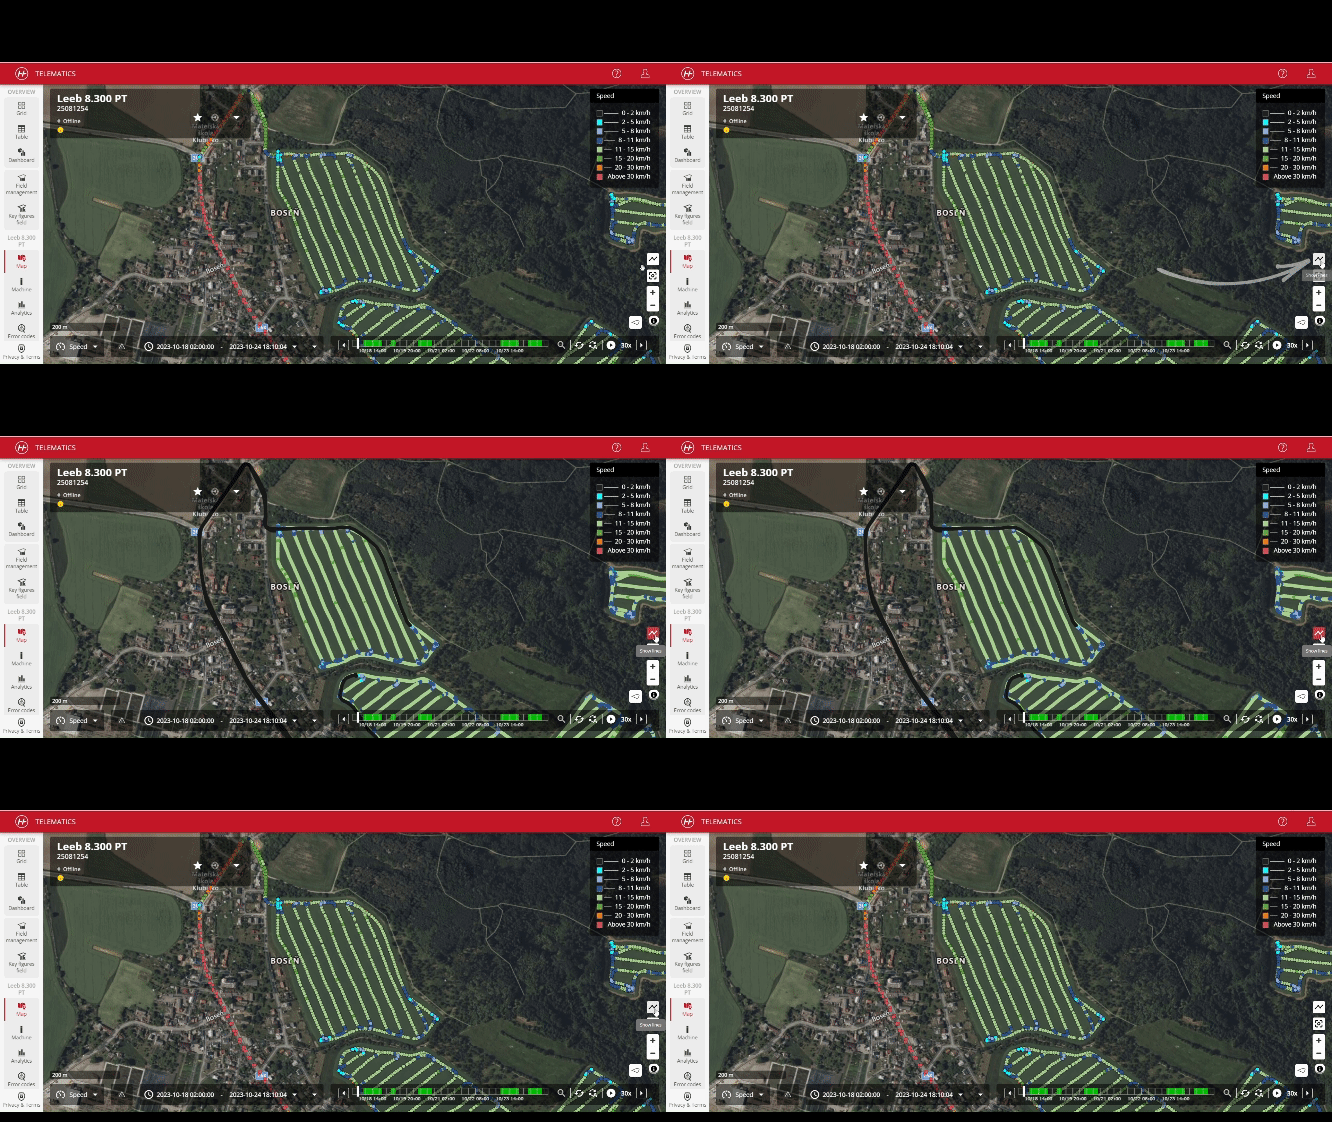
| Another type of view that makes it easier to analyze operations is the display of data points as lines. This view helps to evaluate related data points and relate them to an operation. |
 |
¶ 5. Machine View - Information, Analytics and Error Codes
|
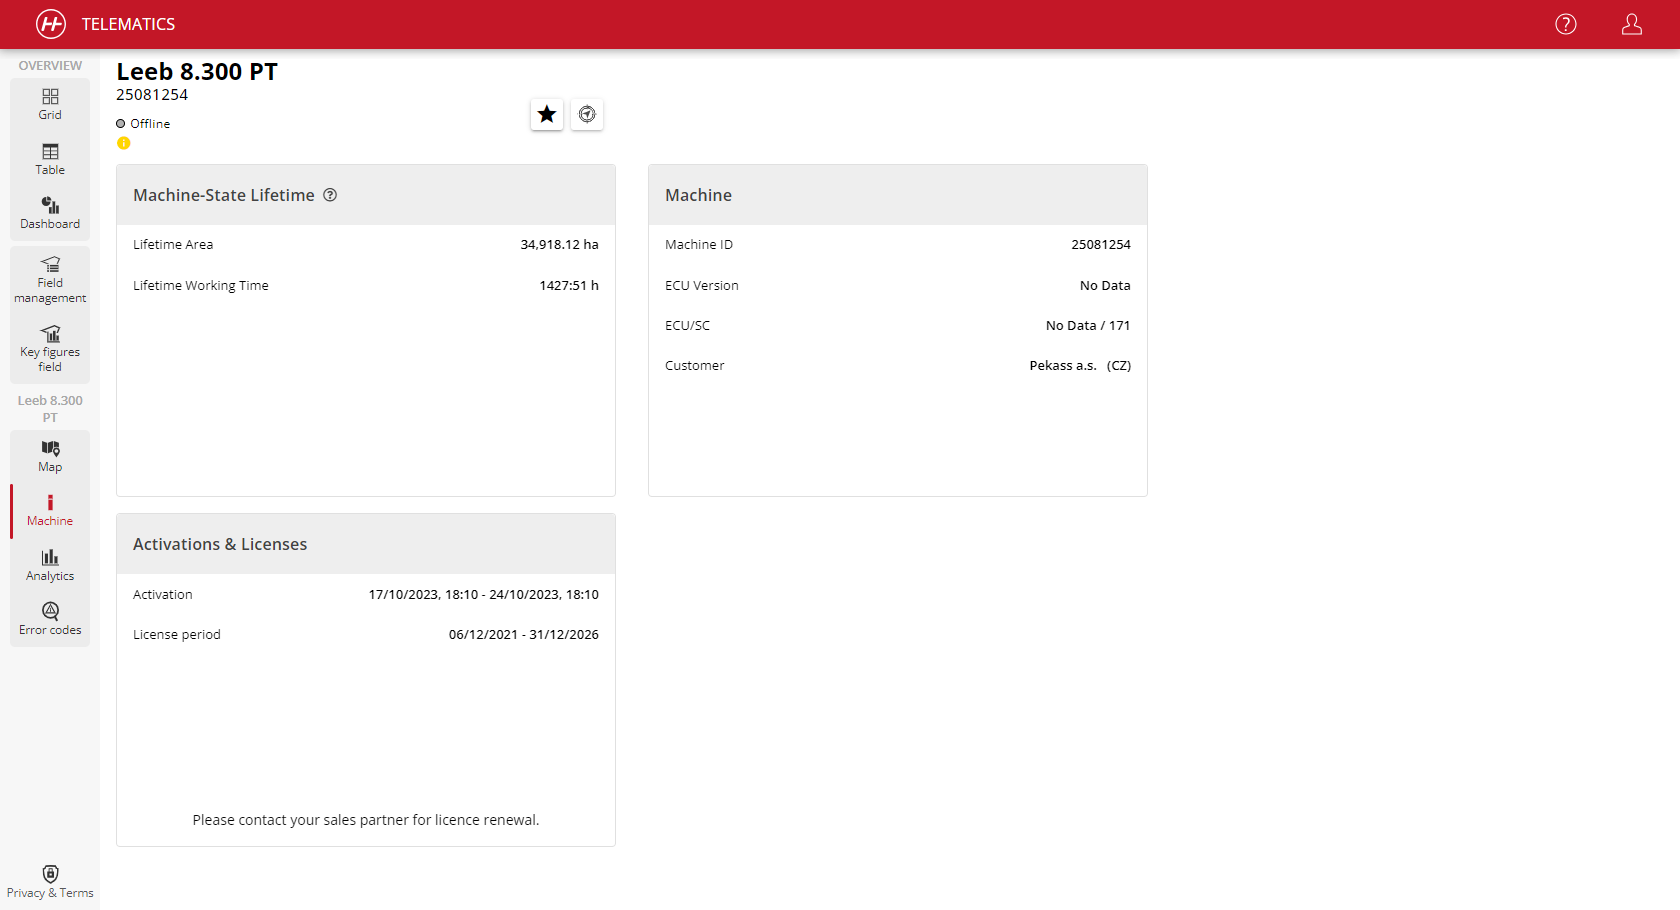
In addition to the map view, more detailed information about the machine such as working hours, machine ID (chassis number), ECU version or Telematics license term can be viewed under the Machine tab. All information relevant for service can be read out here (Figure 5.1). |
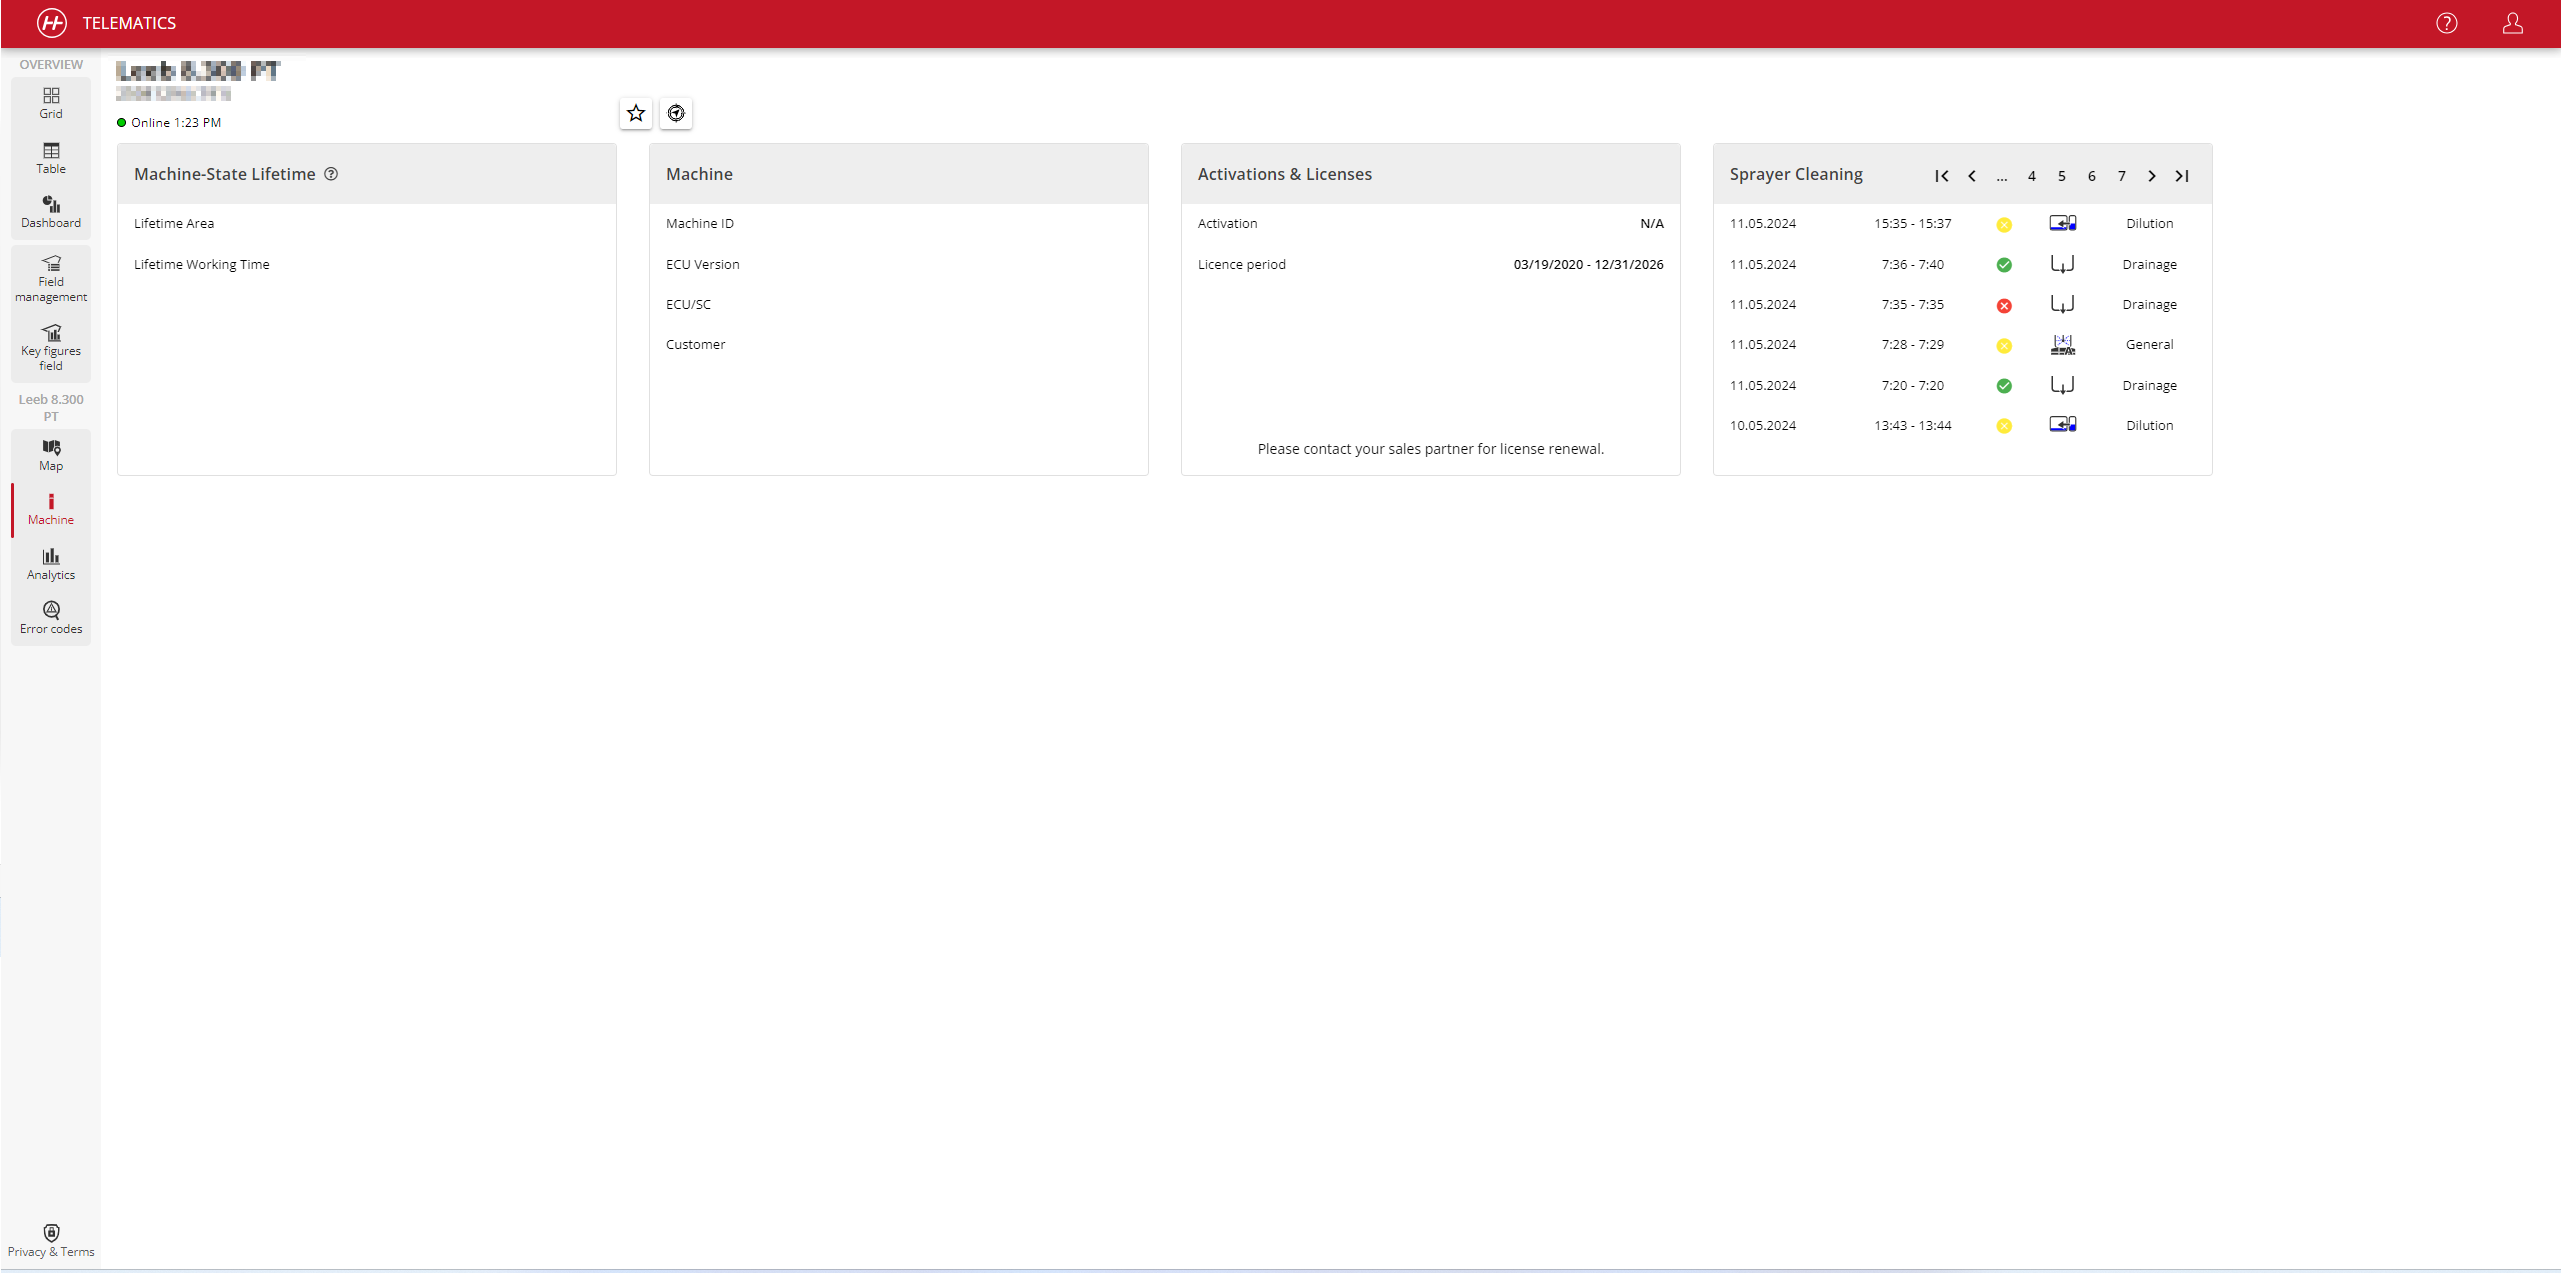 |
Additionally, for LEEB sprayers the status of the cleaning process is logged in Telematics with different status depending on the event. The different stati correspond with the following events:
|
|
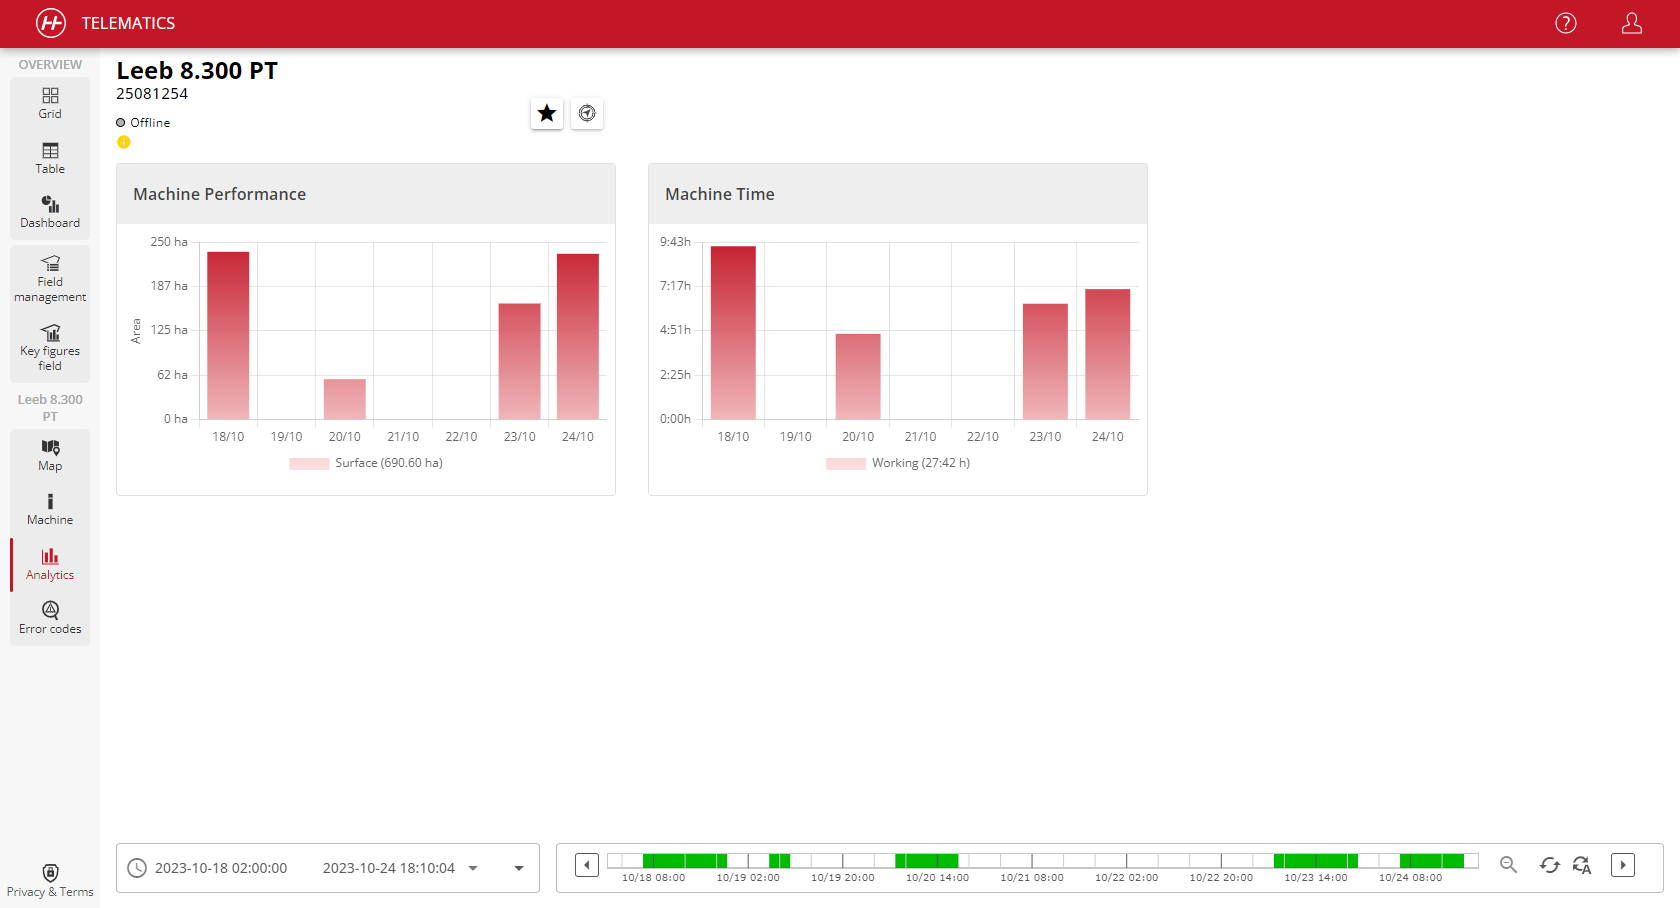
For more detailed evaluations, the Analytics tab can be used to view bar charts on the area coverage and working time of the machine in the selected period. This time restriction can be used to take a closer look at a work process or season (Figure 5.2). |
|
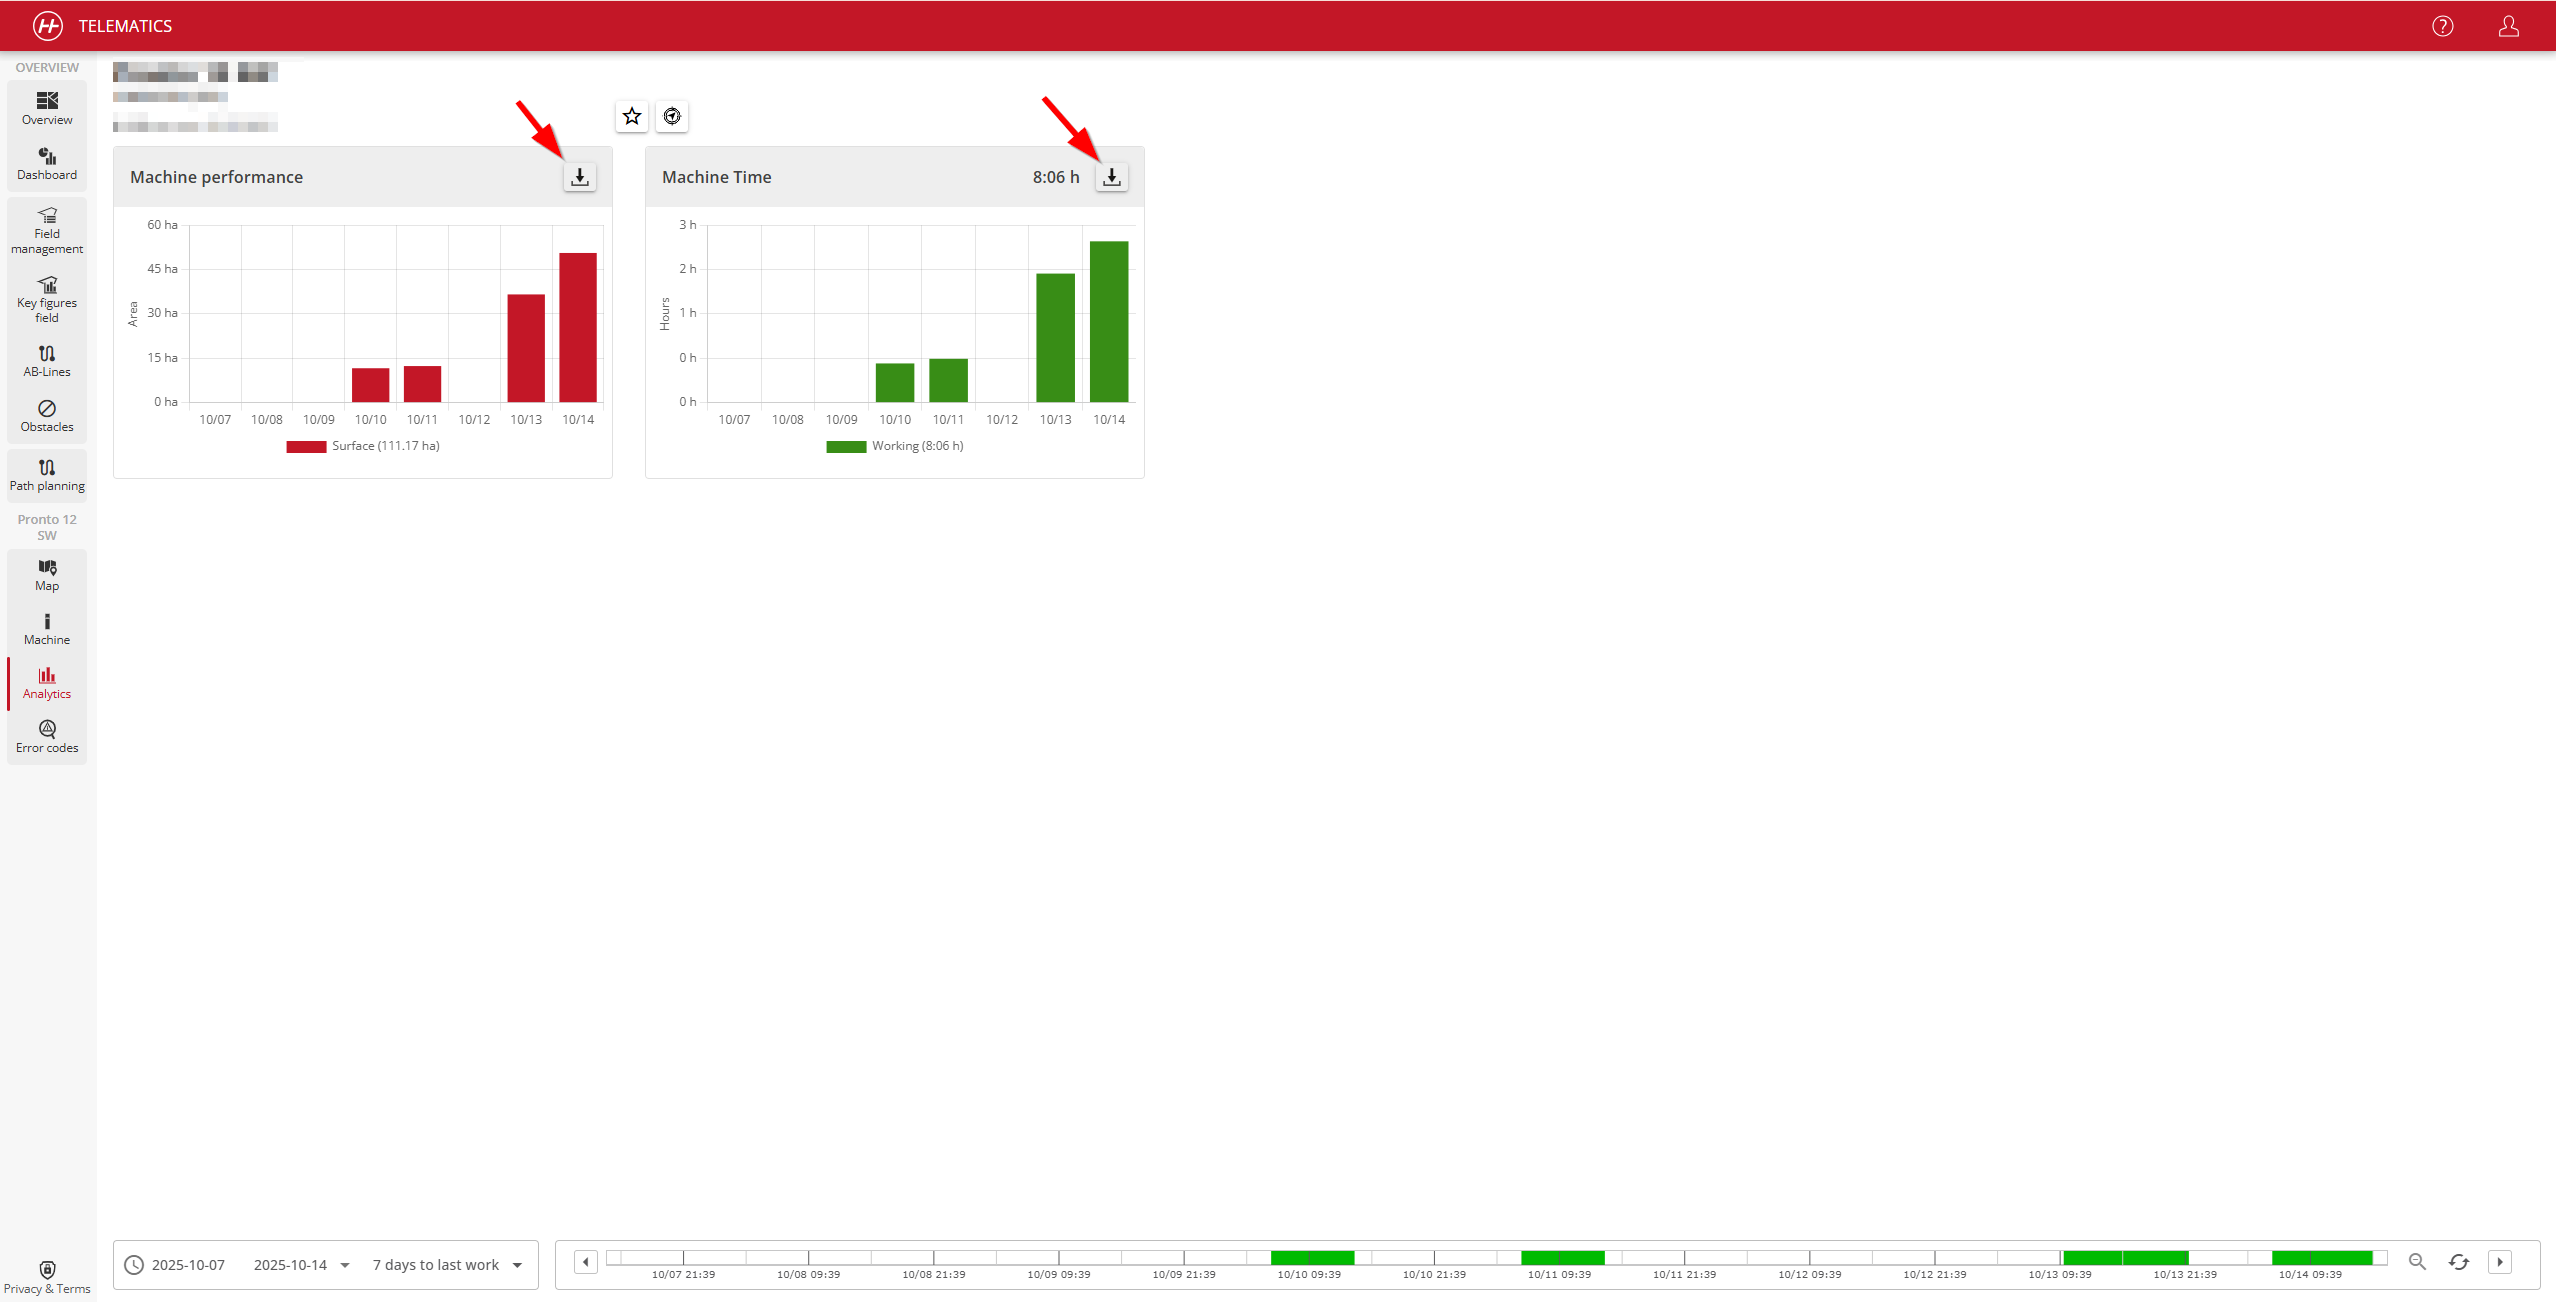
For further analysis, data on different machine metrics can be downloaded via the download button (Figure 5.2.2). The downloaded CSV can be opened in any |
|
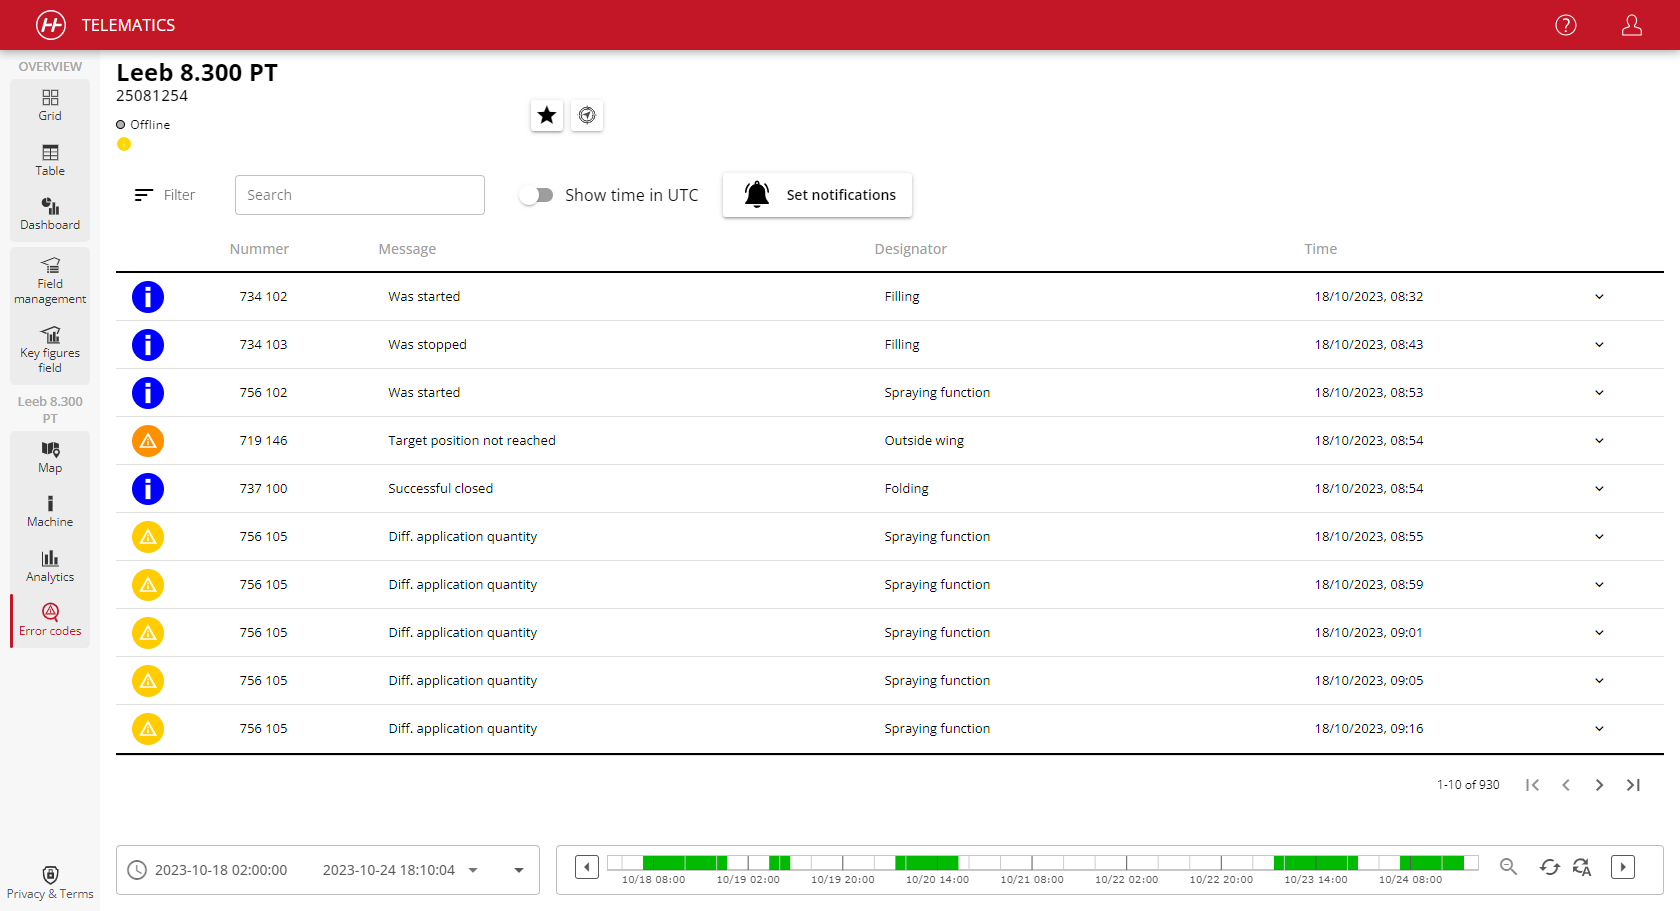
As the last machine-related detailed view, the errors that occurred in the selected period can be displayed under the Error code tab (Figure 5.3). |
|
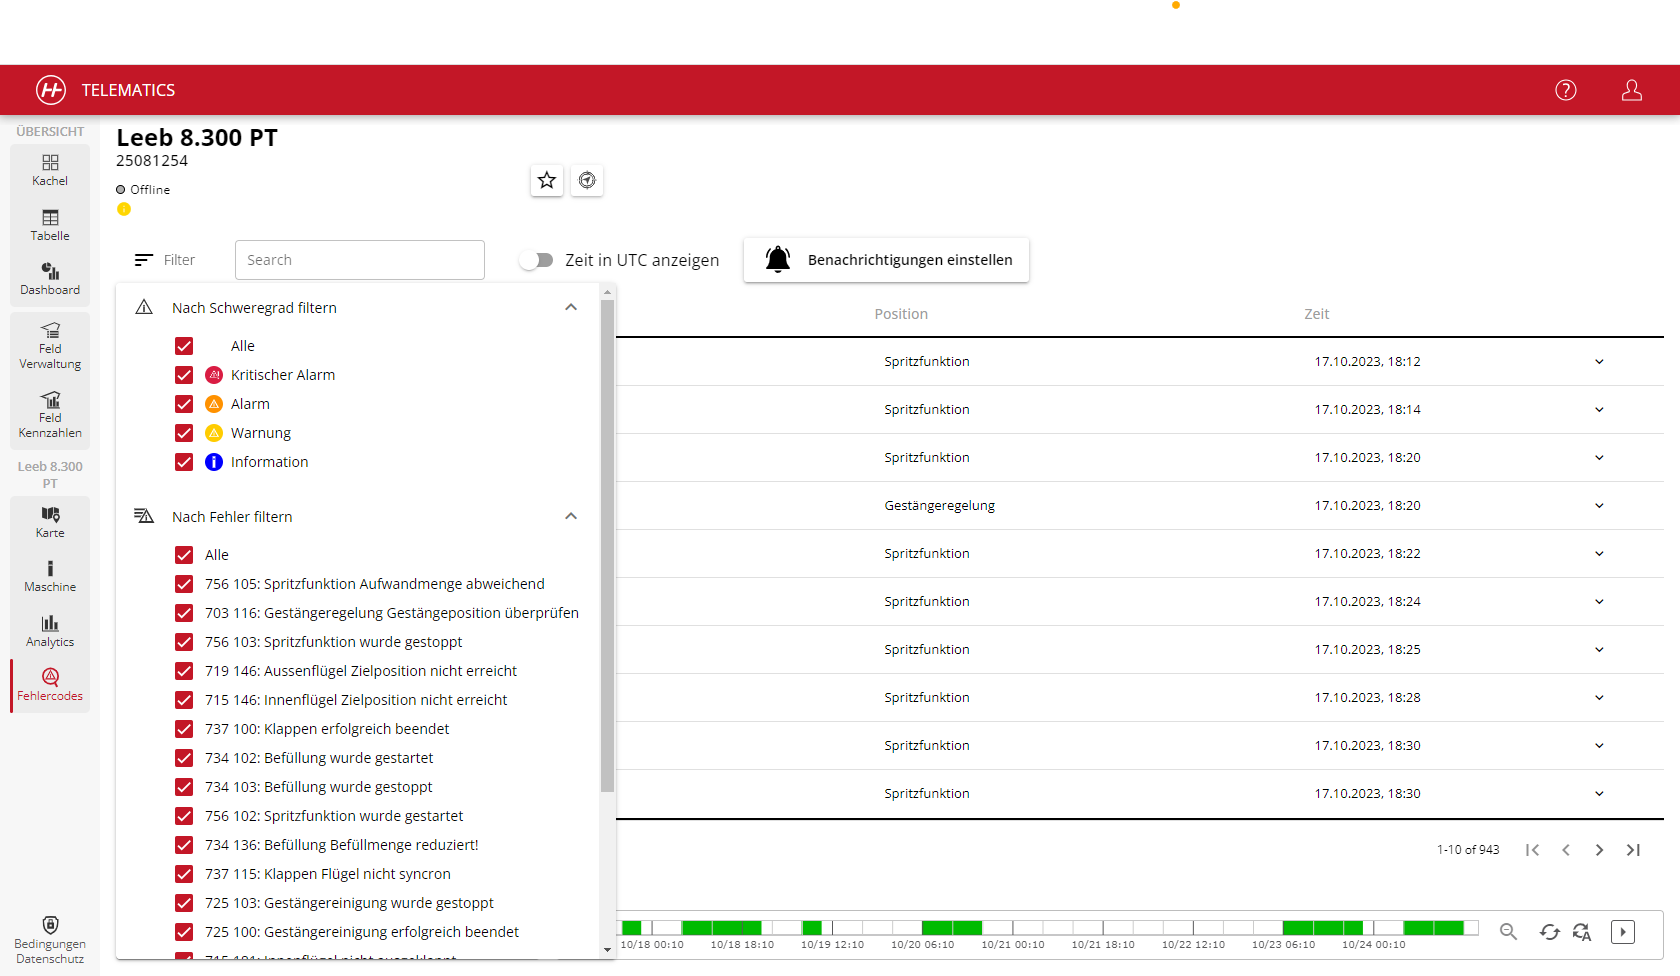
The error messages displayed can be further reduced using filters in order to carry out more precise analyses of the errors that have occurred. The "Filter" button can be used for this purpose, where either severity or specific error types can be selected (see Figure 5.4). Note: Errors can also be searched for using the free text search field. |
|
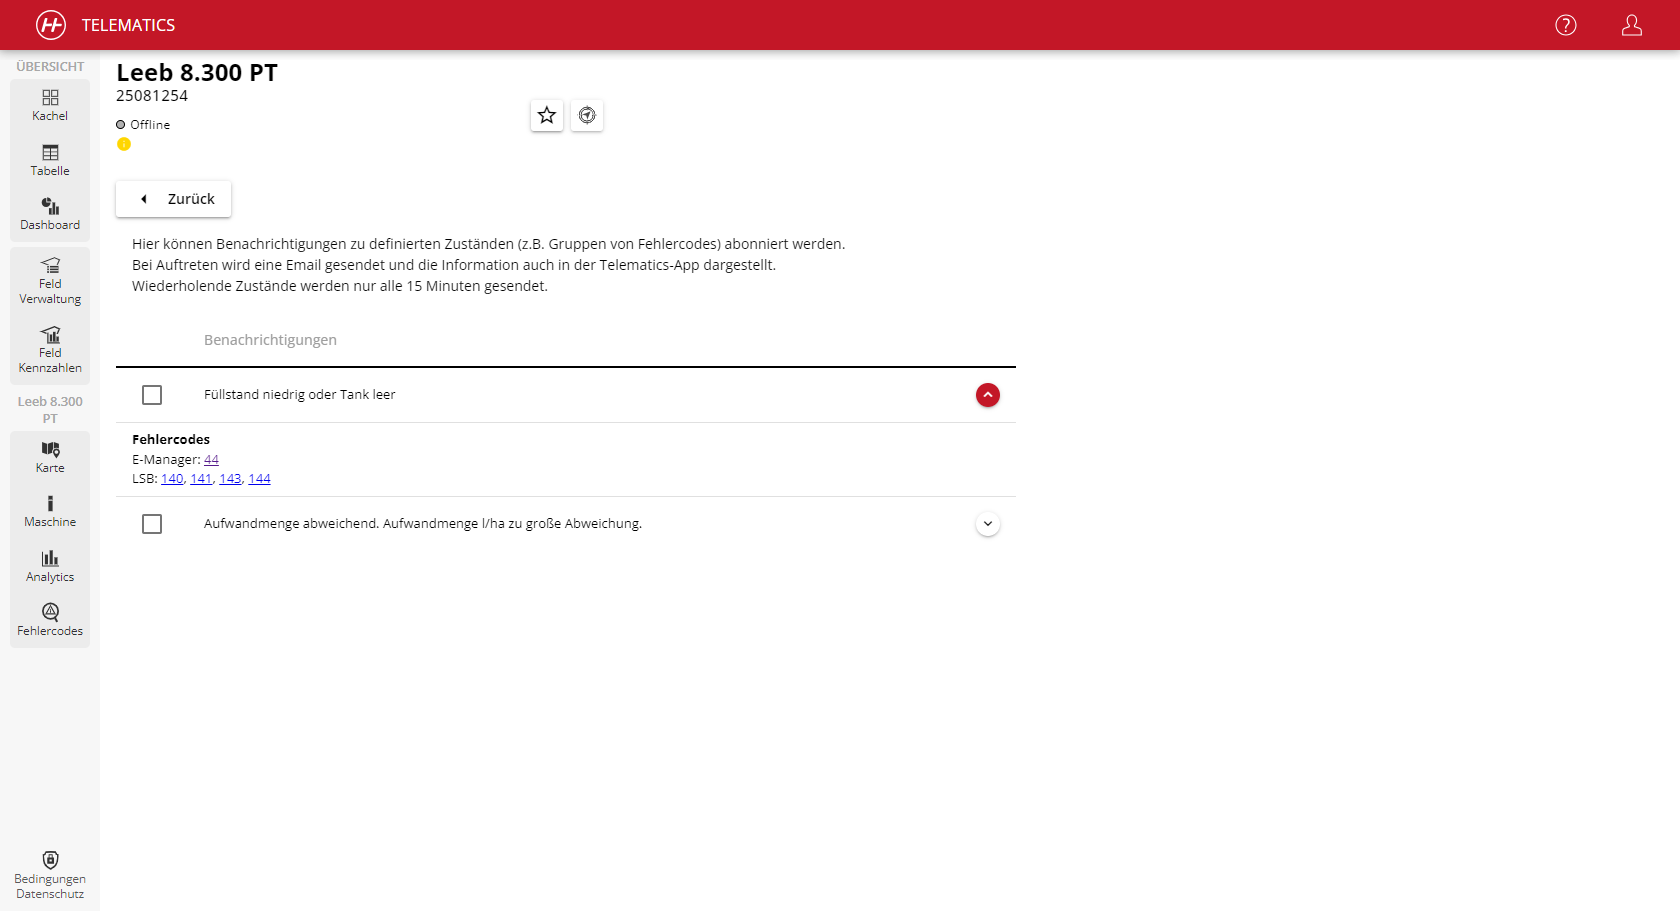
In addition, the "Set notifications" button can be used to create email notifications for defined error groups, which are sent every 15 minutes. The right arrow button can be used to expand the notification tab and display the error codes it contains (Fig. 5.5). |
¶ 6. Account View & API
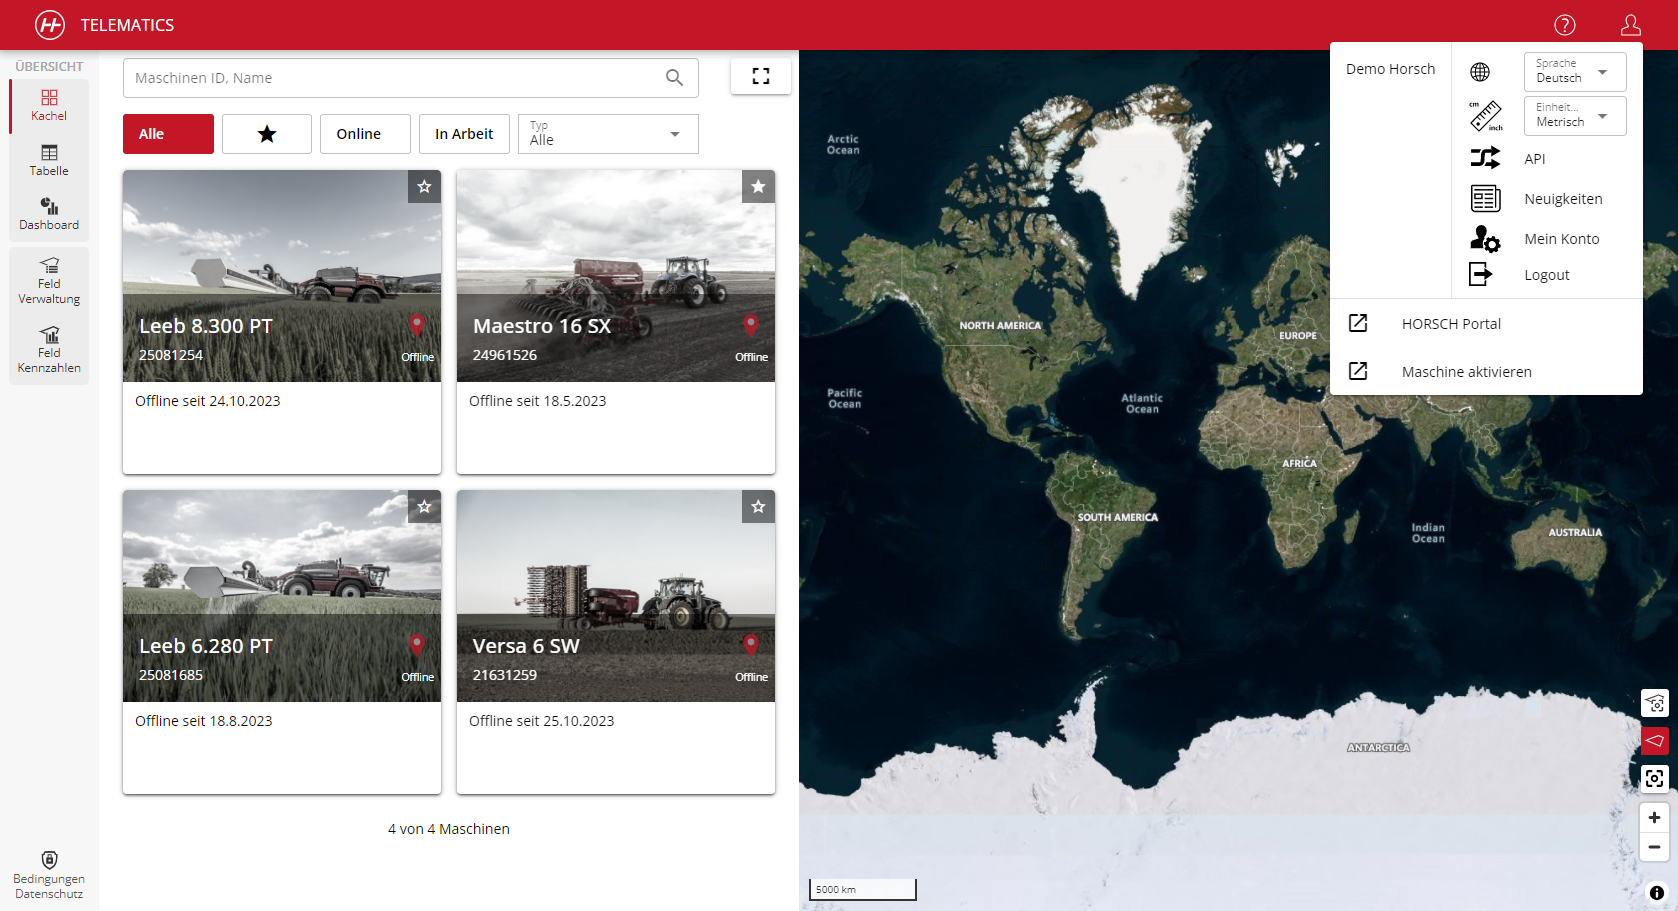
| The account button at the top right can be used to set the account. Here you will find the settings for the display language of the website and the units of measurement used. You can switch between imperial (US, GB) and metric (worldwide) for the units of measurement (Fig. 6.1). |
|
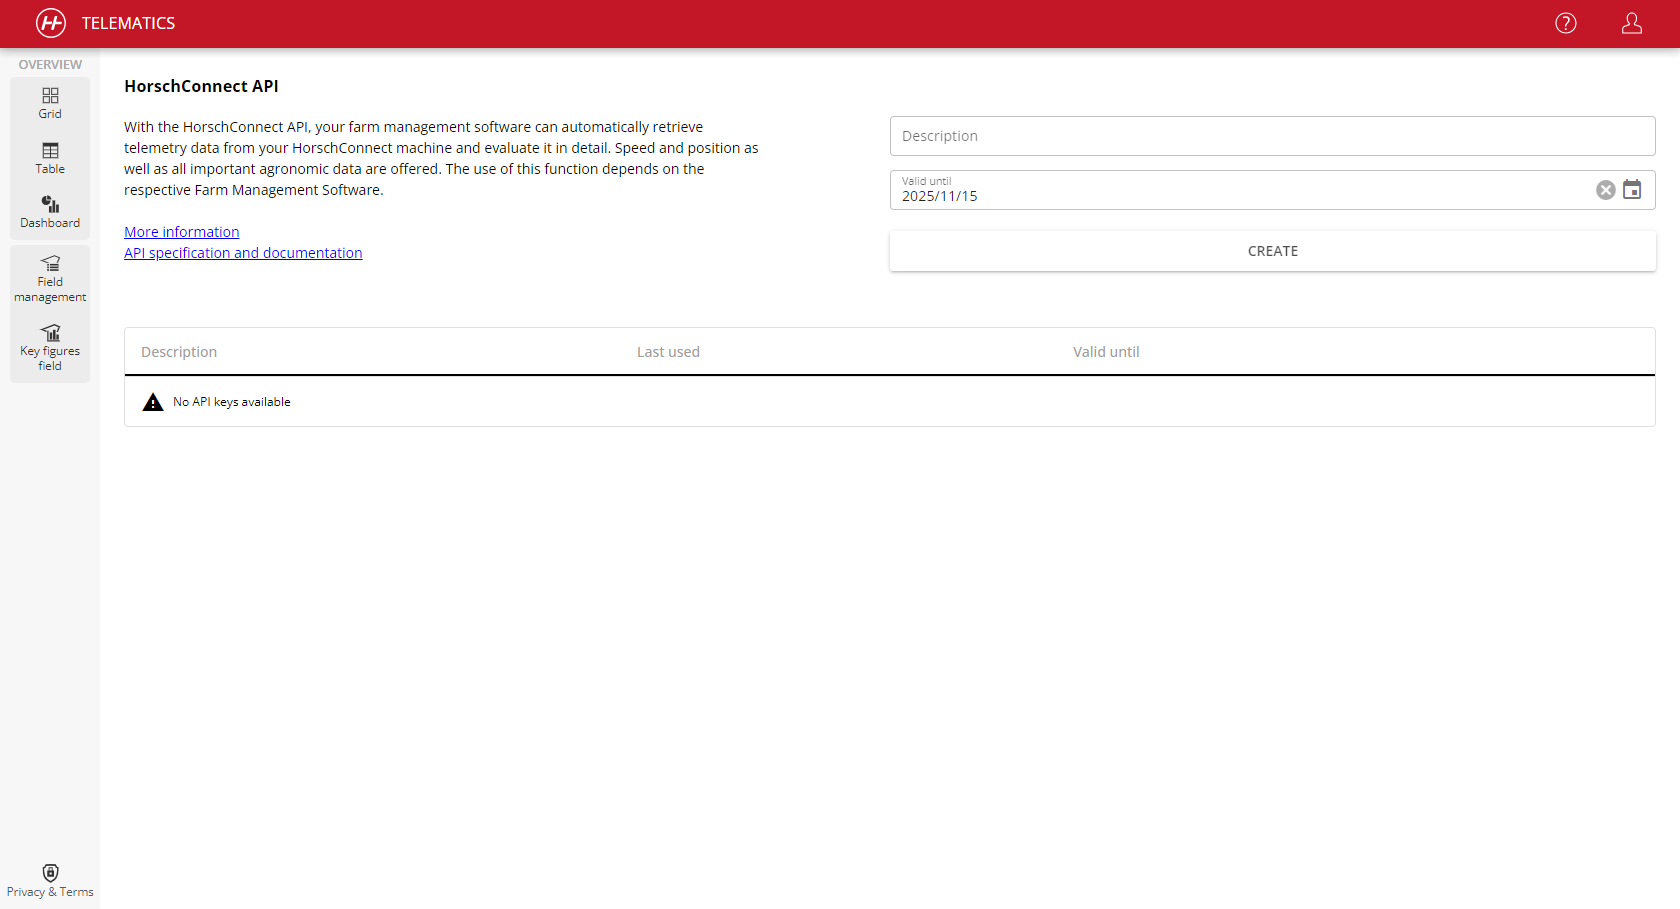
| In this display, an API access (Application Programming Interface) can also be created in order to access the data stored in the system with software from other manufacturers. Each API access must be given a name (description) and validity period (valid until) before it can be created. This can be defined specifically for each access (Figure 6.2). |
|